OPINIONCOMMENTARYTHE PUBLIC SERVICE AND DIGITALISATION
970,000 more in the public service since 2008 – the state is becoming more digital, not leaner
Since the low point in 2008 the public service has grown by a good fifth, in sixteen of seventeen years. The draft budget for 2027 continues this at federal level, although the coalition wants to cut posts. A commentary on a state that is becoming more digital and growing all the same.
By Andreas W. Herb, Founder and CEO MBG Group, Paderborn
7 minutes read9 sources1 correctionDisclosure
Share
Contents
5,475,100
employees in the public service
reference date 30 June 2025, provisional[2]
+970,000
more than in 2008
plus 21.5 per cent since the low point of the series[1]
+4,752
posts at federal level in the 2027 draft budget
against 2026, according to the INSM analysis[5]
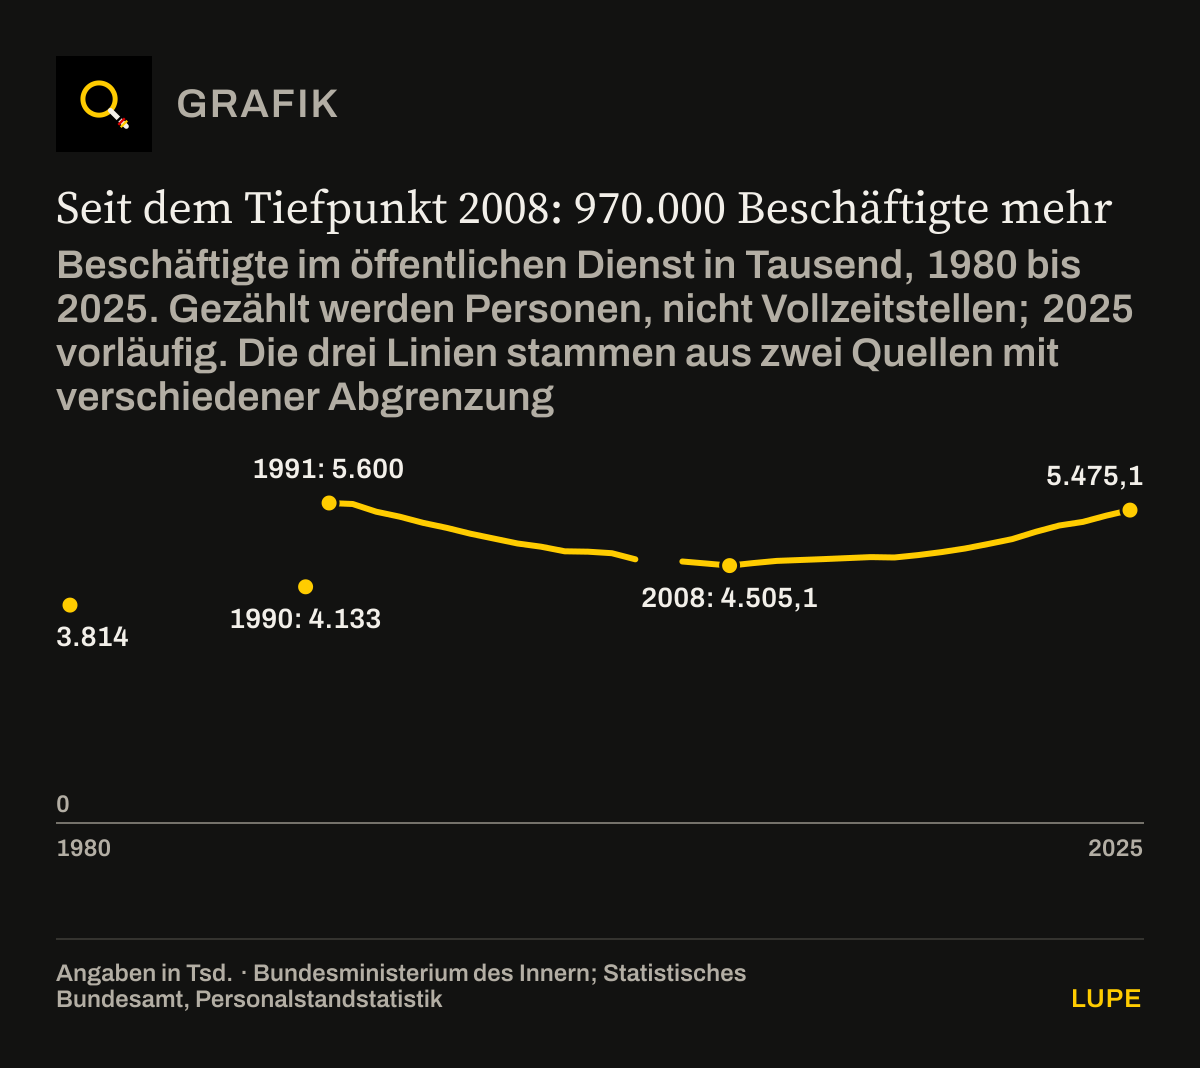
On 30 June 2025, 5,475,100 people were working in the public service in Germany.[2] In 2008 it was 4,505,100.[1] That is 970,000 more, an increase of 21.5 per cent. Almost a million additional employees, in the years in which the smartphone, the cloud and artificial intelligence have rebuilt the world of work.
In business the promise of such technology is: the same work with less effort. In the state’s figures there is no sign of it. The number of employees has risen in sixteen of seventeen years since 2008, most recently by 95,100 in a single year.[1][2]
First a reduction, then the low point in 2008
After reunification it ran the other way. In 1991 the public service excluding the railway and the postal service counted around 5.6 million employees, in 2004 only 4.6 million. The federal interior ministry gave as reasons the strained budget position, the modernisation of administrations and the privatisation of municipal services.[3] So modernisation then meant fewer staff.
Since the low point in 2008: 970,000 more employees
Employees in the public service in thousands, 1980 to 2025. What is counted is people, not full-time posts; 2025 provisional. The three lines come from two sources with different definitions
- 1980 and 1990: former federal territory, excluding railway and postal service (BMI)
- from 2006: official series, reference date 30 June (Destatis)
- 1991 to 2004: Germany, excluding railway and postal service (BMI)
Federal Ministry of the Interior[3]; Federal Statistical Office, public service staff statistics[1][2]. Chart redrawn from the figures in the text.
Limits of the data: The lines are deliberately not joined. The older series of the federal interior ministry does not count the staff of the railway and the postal service, applies up to 1990 only to the former federal territory and gives, for the 1980s, only 1980 and 1990. For 2005 neither source contains a value. Between the series the figures are comparable only as orders of magnitude.
Download the chart as an image (PNG)
Show data table46 rows
| 1980 and 1990: former federal territory, excluding railway and postal service (BMI) (k) | from 2006: official series, reference date 30 June (Destatis) (k) | 1991 to 2004: Germany, excluding railway and postal service (BMI) (k) | |
|---|---|---|---|
| 1980 | 3,814 | – | – |
| 1981 | – | – | – |
| 1982 | – | – | – |
| 1983 | – | – | – |
| 1984 | – | – | – |
| 1985 | – | – | – |
| 1986 | – | – | – |
| 1987 | – | – | – |
| 1988 | – | – | – |
| 1989 | – | – | – |
| 1990 | 4,133 | – | – |
| 1991 | – | – | 5,600 |
| 1992 | – | – | 5,582 |
| 1993 | – | – | 5,448 |
| 1994 | – | – | 5,361 |
| 1995 | – | – | 5,251 |
| 1996 | – | – | 5,165 |
| 1997 | – | – | 5,062 |
| 1998 | – | – | 4,977 |
| 1999 | – | – | 4,891 |
| 2000 | – | – | 4,835 |
| 2001 | – | – | 4,755 |
| 2002 | – | – | 4,747 |
| 2003 | – | – | 4,721 |
| 2004 | – | – | 4,615 |
| 2005 | – | – | – |
| 2006 | – | 4,576 | – |
| 2007 | – | 4,540.6 | – |
| 2008 | – | 4,505.1 | – |
| 2009 | – | 4,547.6 | – |
| 2010 | – | 4,586.1 | – |
| 2011 | – | 4,602.9 | – |
| 2012 | – | 4,617.4 | – |
| 2013 | – | 4,635.2 | – |
| 2014 | – | 4,652.5 | – |
| 2015 | – | 4,645.5 | – |
| 2016 | – | 4,689 | – |
| 2017 | – | 4,739.9 | – |
| 2018 | – | 4,802.9 | – |
| 2019 | – | 4,884.8 | – |
| 2020 | – | 4,968 | – |
| 2021 | – | 5,095.6 | – |
| 2022 | – | 5,206 | – |
| 2023 | – | 5,270 | – |
| 2024 | – | 5,380 | – |
| 2025 | – | 5,475.1 | – |
2008 was the low point. Since then the public service has been growing, and in sum digitalisation has reversed nothing about that. Yet the expectation was formulated early. In 2006 the federal interior ministry wrote that the BundOnline 2005 programme had shown that “savings potential from e-government can also be used for budget consolidation”.[3]
Where the staff were added
Anyone wanting to judge fairly has to look at where the 970,000 work. More than half of the increase is accounted for by four areas in which people do the work and not software: universities with their clinics, municipal day-care centres, schools and the police.[1]
| Area of responsibility | 2008 | 2025 | Increase |
|---|---|---|---|
| Universities with clinics | 432,700 | 651,300 | +218,600 |
| Municipal day-care centres | 136,600 | 298,000 | +161,400 |
| Schools | 932,200 | 1,069,600 | +137,400 |
| Police | 307,000 | 358,800 | +51,800 |
| These four together | 1,808,500 | 2,377,700 | +569,200 |
| All remaining areas | 2,696,600 | 3,097,400 | +400,800 |
| Public service in total | 4,505,100 | 5,475,100 | +970,000 |
The four areas account for 569,200 of the 970,000 additional employees, that is 58.7 per cent. 2025 is provisional. Staff in police training in Hesse have been assigned to universities from 2022; that does not change the total for the four areas.[1]
Teachers, childcare workers and police officers are not the problem. More childcare places and more teachers are politically wanted, and most parents want them too. For the question about digitalisation what counts is the second-to-last row: in all the remaining areas together, 400,800 more people work today than in 2008, an increase of almost 15 per cent.[1] This remainder contains the offices in which applications, decisions and files are processed, from general administration through tax offices and the justice system to social insurance. That is precisely where digitalisation ought to save work.
Digital and bigger all the same
I run a company. When we invest in software, we expect the same work to cost less time afterwards. If we invest for twenty years and end up needing a fifth more people, then the software has missed its purpose. Or we never switched off the old processes.
My impression is that in the state it is the second: the digital is added, the paper stays. Online application and paper file run side by side, new rules bring new documents, and for new levies new posts arise to collect them. So a tool for saving becomes an additional task. This impression cannot be proved with the staffing statistics, which count heads and not processes. But they do show that in sum no saving has arrived.
The federal government keeps planning upwards
For the largest part of this increase the federal government and its ministers are not responsible. Schools, universities and most of the police are a matter for the Länder, and the day-care centres counted here belong to the municipalities. At federal level, though, the finance minister has a say. Lars Klingbeil introduced the draft budget for 2027 in the Bundestag in September.[4]
According to an analysis by the Initiative Neue Soziale Marktwirtschaft, this draft provides for 310,487 posts in the federal administration, 4,752 more than in 2026 and 12,347 more than in 2024. Staff spending is to rise by 7.5 per cent to 51.62 billion euros.[5] The initiative is financed by employers’ associations in the metal and electrical industries and calls for a freeze on recruitment; its figures come from the budget plans.
Yet the coalition of the Union and the SPD has set itself the aim of cutting staff numbers in the ministries, the Bundestag administration and certain subordinate authorities by at least eight per cent by 2029.[6] The draft for 2027 contains a savings requirement of two per cent for this. Customs, the federal police, the federal criminal police office and the armed forces are exempt from it, and newly created posts do not count in the calculation.[7]
On top of this come new tasks from Klingbeil’s own house. For the planned sugar tax and the plastic tax, papers from the finance ministry provided, according to media reports, for 1,046 new posts in total, most of them at customs.[8] For the version of the sugar tax that the cabinet adopted on 14 October, the federal government has published no staffing requirement.[9] Two new taxes for which a thousand new posts are planned to begin with: that is the opposite of an administration becoming leaner through digitalisation. The details are in my commentary Klingbeils indirekte Steuern.
What I expect
I do not want a weak state, and I do not dispute anyone’s work in the public service. But after twenty years of e-government one may expect an account: which processes have become digital, which paper routes have fallen away for them, and how many posts has that saved? As long as that account is missing, no new administrative post should be created without proof of which task it takes on and which old one falls away for it.
For the federal government that means: the coalition’s eight per cent target applies, and it does not begin only in 2028. A budget that opens the promised reduction with 4,752 additional posts does not take its own promise seriously. How staff numbers have grown since 2015 and where to is set out in full in my commentary Der Staat wächst. Die Rechnung zahlen wir.
Andreas W. HerbFounder and CEO MBG Group, Paderborn
What I expressly do not claim
It is not a million but 970,000 more employees. I compare with 2008 because that is where the low point of the official series lies; any other starting point in this series would give a smaller increase, against 2015 around 829,600.[1] What is counted is heads, not full-time posts; how much of the increase is accounted for by part-time work this series does not show. The largest part of the increase lies with the Länder and the municipalities, not with the federal government. I do not claim that digitalisation caused the increase, nor that without it even more staff would not have been needed. The statistics show only that the number of employees has risen despite digitalisation. The assessment is my opinion.
METHOD
Method
Increase since 2008, from the Destatis time series as at 30 June (values in thousands): 5,475.1 − 4,505.1 = 970.0. In per cent: 970.0 ÷ 4,505.1 = 21.5 per cent. Against 2015: 5,475.1 − 4,645.5 = 829.6. The value for 2025 is provisional.
Four areas, 2008 to 2025: universities 651.3 − 432.7 = 218.6; municipal day-care centres 298.0 − 136.6 = 161.4; schools 1,069.6 − 932.2 = 137.4; police 358.8 − 307.0 = 51.8. Together 569.2, that is 58.7 per cent of 970.0.
Remaining areas: in 2008 it was 4,505.1 − 1,808.5 = 2,696.6, in 2025 it is 5,475.1 − 2,377.7 = 3,097.4. The increase of 400.8 corresponds to 14.9 per cent.
Years with an increase: from 2008 to 2025 the number rose in every year except 2015 (4,645.5 after 4,652.5 in 2014), that is in sixteen of seventeen years.
1991 and 2004 according to the federal interior ministry’s table based on specialist series 14, series 6: 5,600 and 4,615 thousand, excluding the staff of the railway and the postal service. In addition 1980 and 1990 for the former federal territory: 3,814 and 4,133 thousand. This definition differs from the official series from 2006; the values are therefore comparable only as orders of magnitude and appear in the chart as lines of their own.
Federal posts: the figures 298,140 (2024), 305,753 (2026) and 310,487 (2027) come from the INSM analysis and are counted there from the budget plans and the 2027 government draft.
CHECK
What was checked before publication
- All the staffing figures were checked on 24 October 2026 against the time series of the Federal Statistical Office and against its press release of 22 June 2026. The value for 2025 is provisional. What is counted is people, not full-time posts.
- The author’s draft spoke of a million additional employees. The official figure is 970,000; the text uses that figure.
- Like the draft, the chart reaches back to 1980. The values up to 2004 come from a table of the federal interior ministry excluding the railway and the postal service, and up to 1990 only for the former federal territory; from 2006 they come from the official series. The draft partly joined these series; here they stand as separate lines, because they count differently. The draft’s additional official series for 1995 to 2005 has not been taken over; it could not be checked against any freely available primary source.
- The number of federal posts comes from an analysis by the INSM, an initiative financed by employers’ associations. We have not counted them in the government draft itself. The savings requirement of two per cent and its exceptions are documented via the Bundestag, the eight per cent target via the federal government’s answer to a parliamentary question.
- The 1,046 posts for the sugar and plastic taxes go back to media reports about finance ministry papers. For the version of the sugar tax adopted on 14 October 2026 the federal government has published no staffing requirement.
- Not checked: how much of the increase is accounted for by part-time work and how many posts digitalisation has actually saved. We found no official overall calculation of this. The federal government and the finance ministry were not asked for comment.
SOURCES
Sources
Every number in the text leads to its source. The origin is given at each entry: official, media report, trade association, institute or data portal. Titles stay in the original language, so that each document can still be found.
[1] Statistisches Bundesamt (Destatis), Stand 22.06.2026
Entwicklung der Beschäftigten des öffentlichen Dienstes nach ausgewählten Aufgabenbereichen, Stichtag 30. Juni (Zeitreihe 2006 bis 2025)Official source↑ back to the text
[2] Statistisches Bundesamt (Destatis), 22.06.2026
Öffentlicher Dienst 2025: Mehr Beschäftigte in der Bildung und Kinderbetreuung (Pressemitteilung Nr. 215)Official source↑ back to the text
[3] Bundesministerium des Innern, 2006
Der öffentliche Dienst in Deutschland (S. 27 zu BundOnline 2005, S. 30 und 31 zur Entwicklung des Personalstands)Official source↑ back to the text
[4] ZDFheute, 08.09.2026
Klingbeil legt Etatpläne 2027 im Bundestag vor: Die EckpunkteMedia report↑ back to the text
[5] Initiative Neue Soziale Marktwirtschaft (INSM), 01.09.2026
INSM-Studie: Regierungsapparat wächst weiter (Pressemitteilung zur Studie „Stellenmehrung in der Bundesverwaltung – Bundeshaushalt 2017 bis Planentwurf 2027“)Trade association↑ back to the text
[6] Deutscher Bundestag, 28.04.2026
Drucksache 21/5666: Antwort der Bundesregierung auf die Kleine Anfrage „Geplante Stelleneinsparungen in der Bundesverwaltung von mindestens 8 Prozent bis zum Jahr 2029“ (mit dem Wortlaut des Koalitionsvertrags)Official source↑ back to the text
[7] Deutscher Bundestag (hib 656/2026), 21.08.2026
Haushalt 2027: Zwei Prozent Stelleneinsparung geplant (zum Entwurf des Haushaltsgesetzes 2027, Drucksache 21/7300)Official source↑ back to the text
[8] t-online, 06.10.2026
Zuckersteuer und Plastiksteuer: 1046 neue Beamte benötigtMedia report↑ back to the text
[9] Bundesministerium der Finanzen, 14.10.2026
Bundeskabinett bringt Gesetzentwurf für Zuckergetränkesteuer auf den Weg (Pressemitteilung)Official source↑ back to the text
CORRECTIONS
Corrections
What was wrong: Nothing. The chart showed only the official series from 2006, while the author’s draft reached back to 1980.
What was changed: The chart now shows 1980 to 2025: 1980 and 1990 for the former federal territory and 1991 to 2004 for Germany, both from the federal interior ministry’s table excluding the railway and the postal service, plus, as before, the official series from 2006. The three series appear as separate lines. The text and figures of the commentary are unchanged.
Why: At the author’s request, so that the chart shows the reduction after reunification as his draft did.
This page is opinion. Our fact checks are not.