BACKGROUNDFACT PAPERTAX ON SUGARY DRINKS
Sugar in drinks: what the official figures show
Sugar content, sugar sales and the planned tax. Every figure comes from an official source and has been recalculated, with all the qualifications.
Basis: research by the editorial team in official statistics
4 minutes read8 sources0 corrections
Share
Contents and Documents
The federal government wants to tax sugar-sweetened drinks. The official figures show three things. Manufacturers have cut the sugar per litre without a tax. Pure juices contain about as much sugar as cola and are to remain untaxed. And the drinks sector has nevertheless bought slightly more sugar of late.
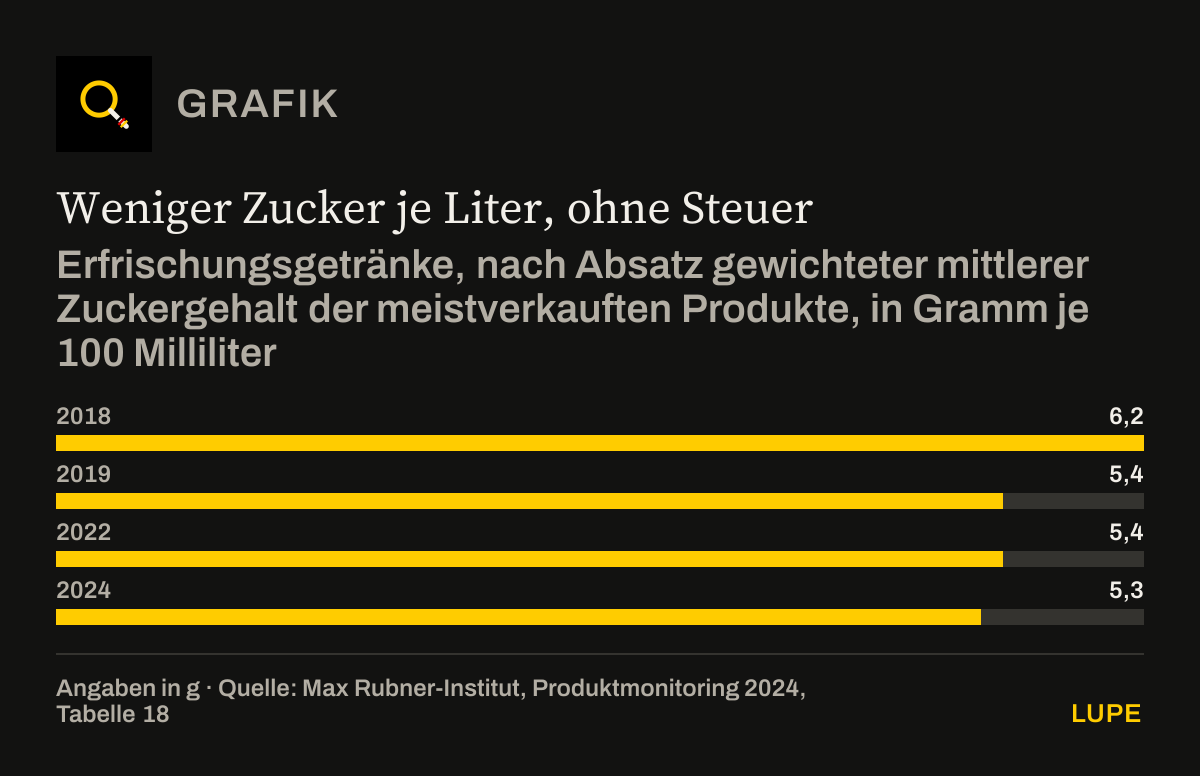
Sugar per 100 ml in the best-selling soft drinks
6.2 g → 5.3 g
From 2018 to 2024 the sugar content, weighted by sales volume, fell by almost 15 per cent.[1][2] There was no sugar tax during that period.
Mean of the best-selling products. The Max Rubner Institute considers part of the differences between the years to be possibly due to method.
1. Less sugar per litre, without a tax
The federal government’s Max Rubner Institute measures regularly how much sugar is in the best-selling soft drinks. Weighted by sales volume, the content fell from 6.2 grams per 100 millilitres in 2018 to 5.3 grams in 2024.[1] The federal ministry for agriculture, food and Heimat speaks of almost 15 per cent less sugar.[2] There was no sugar tax during that period.
Two qualifications belong here. The fall came almost entirely in the first year; since 2019 the value has stood between 5.3 and 5.4 grams. And the institute itself writes that the differences between the years may also be due to method, because the first survey covered only 59.5 per cent of the market and the last one 76.9 per cent.[1]
Less sugar per litre, without a tax
Soft drinks, mean sugar content of the best-selling products weighted by sales volume, in grams per 100 millilitres
Source: Max Rubner Institute, product monitoring 2024, table 18[1]. Chart redrawn from the figures in the text.
Limits of the data: In 2020, 2021 and 2023 there was no survey. Market share covered in 2018: 59.5 per cent, in 2024: 76.9 per cent
Download the chart as an image (PNG)
Show data table4 rows
| Sugar (g) | |
|---|---|
| 2018 | 6.2 |
| 2019 | 5.4 |
| 2022 | 5.4 |
| 2024 | 5.3 |
2. Juices: as much sugar as cola, but untaxed
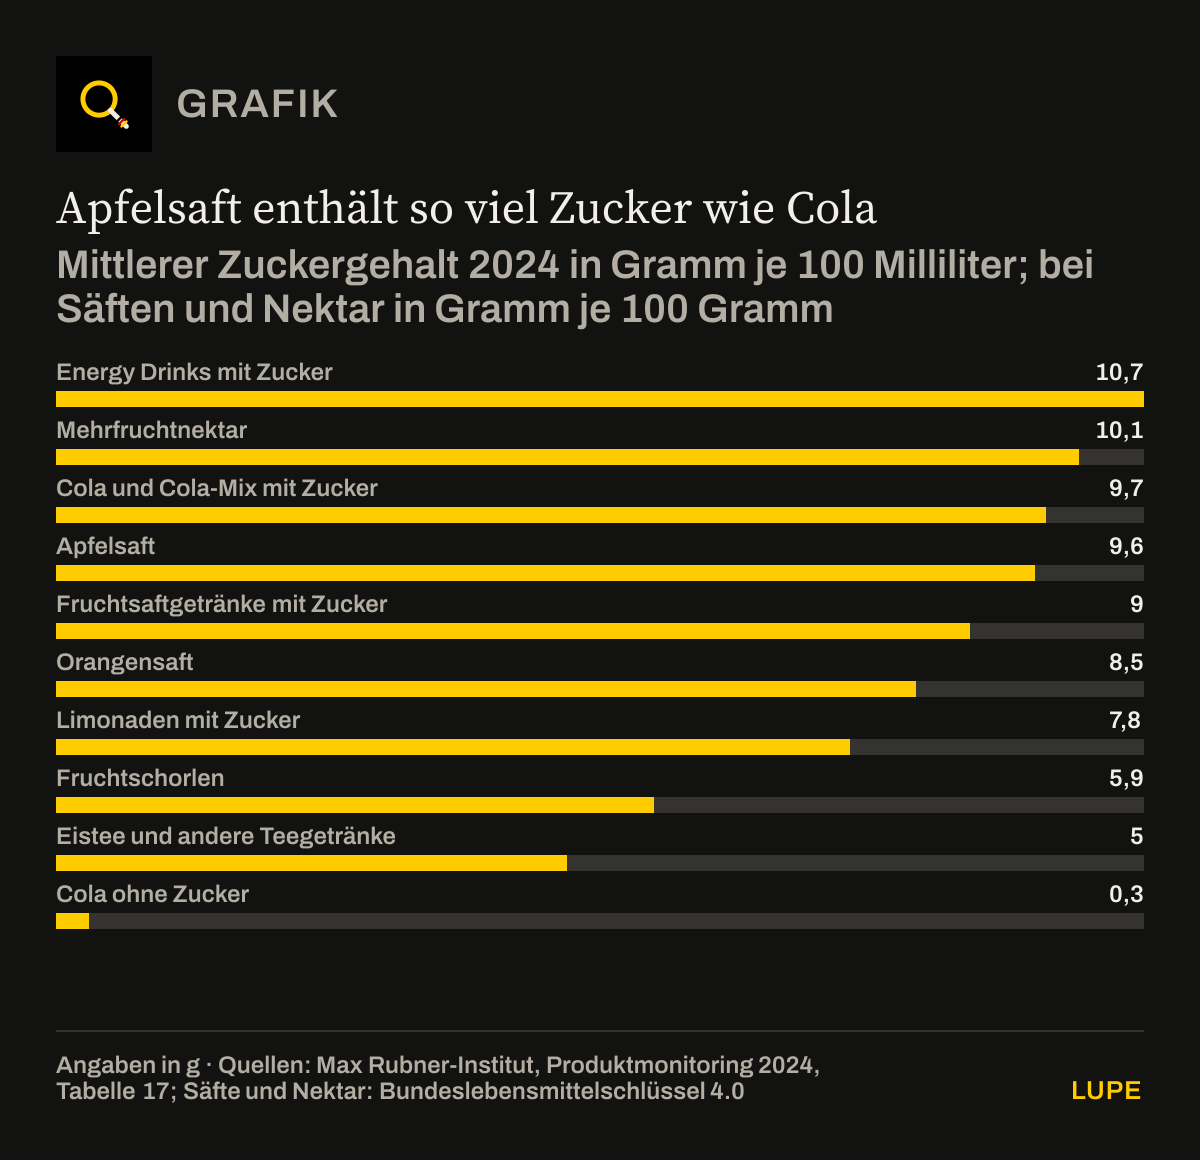
How much sugar a drink contains depends heavily on the type. Cola with sugar averages 9.7 grams per 100 millilitres, energy drinks 10.7, lemonades 7.8 and fruit spritzers 5.9; cola without sugar comes to 0.3.[1] Apple juice naturally contains 9.6 grams per 100 grams, orange juice 8.5.[3]
Apple juice contains as much sugar as cola
Mean sugar content in 2024 in grams per 100 millilitres; for juices and nectar in grams per 100 grams
Sources: Max Rubner Institute, product monitoring 2024, table 17[1]; juices and nectar: German nutrient database 4.0[3]. Chart redrawn from the figures in the text.
Limits of the data: Soft drinks: mean of the best-selling products weighted by sales volume. Juices and nectar: sum of glucose, fructose and sucrose per 100 grams; a litre of juice weighs somewhat more than a kilogram, so the value per 100 millilitres is somewhat higher
Download the chart as an image (PNG)
Show data table10 rows
| Sugar (g) | |
|---|---|
| Energy drinks with sugar | 10.7 |
| Multi-fruit nectar | 10.1 |
| Cola and cola mixes with sugar | 9.7 |
| Apple juice | 9.6 |
| Fruit juice drinks with sugar | 9 |
| Orange juice | 8.5 |
| Lemonades with sugar | 7.8 |
| Fruit spritzers | 5.9 |
| Iced tea and other tea drinks | 5 |
| Cola without sugar | 0.3 |
The health finance commission, on whose recommendation the tax goes back, expressly excludes pure juices: “Excluded are 100 % fruit juices as well as drinks consisting exclusively of 100 % fruit juice and water.”[5]
The federal government says it is guided by this recommendation.[6] According to media reports the finance ministry’s draft also leaves pure juices and spritzers without added sugar untaxed.[7] For fruit nectar there is no official statement; it does not appear on the commission’s list of exclusions. So the tax asks not only how much sugar is in the glass, but also where it comes from.
3. More sugar in the drinks sector’s purchases
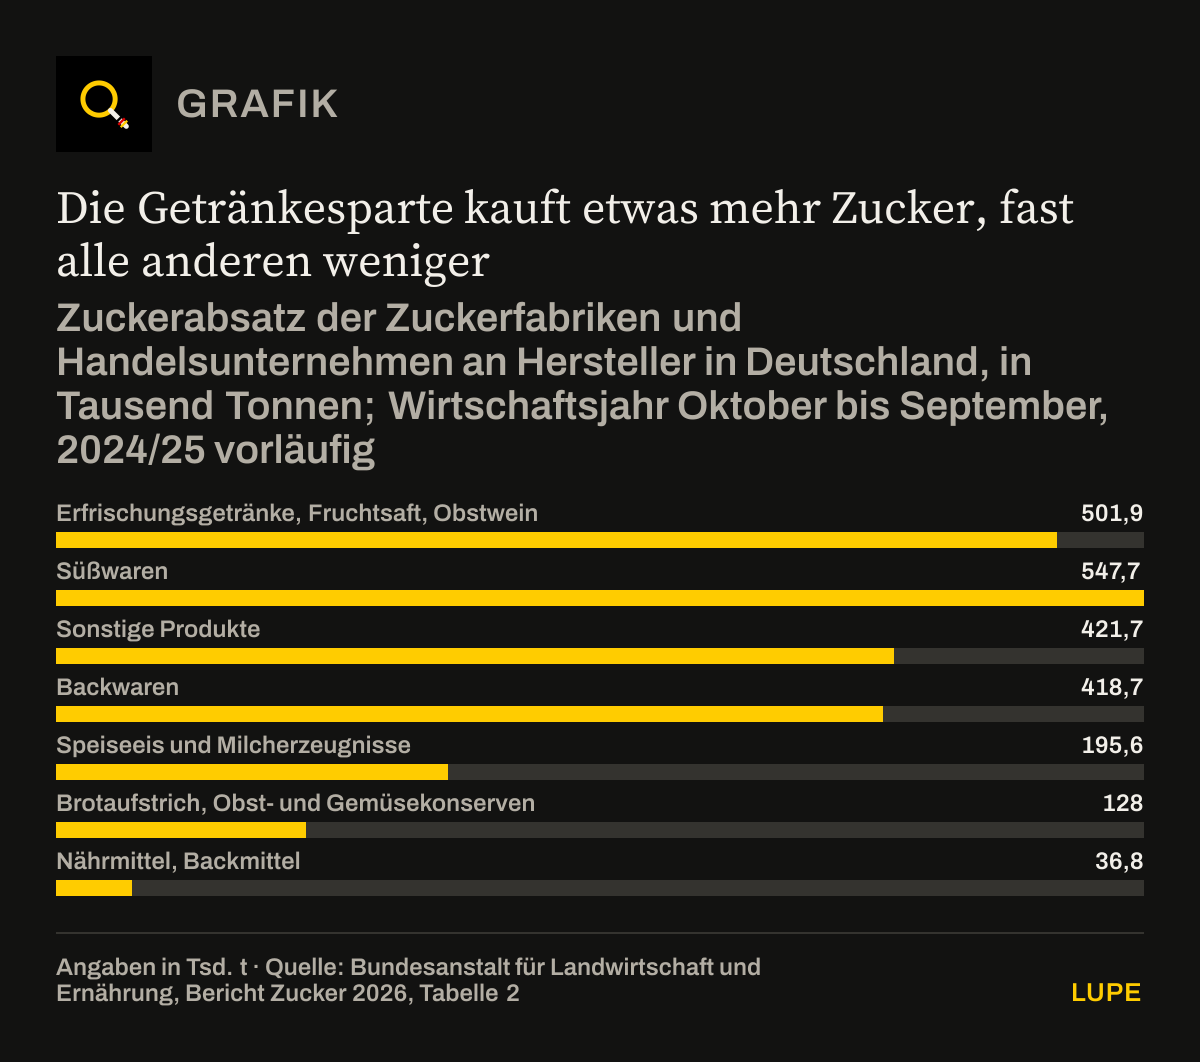
According to provisional figures, in the 2024/25 marketing year sugar factories and traders sold 512.8 thousand tonnes of sugar to the makers of soft drinks, fruit juice and fruit wine. That is 2.2 per cent more than the year before. According to the Federal Office for Agriculture and Food, almost all other food sectors bought less: confectionery makers 9.6 per cent less, bakery product makers 6.1 per cent. The only other exception is “other products”, up 1.3 per cent.[4]
The drinks sector buys slightly more sugar, almost all the others less
Sugar sold by sugar factories and trading companies to manufacturers in Germany, in thousands of tonnes; marketing year October to September, 2024/25 provisional
- 2023/24
- 2024/25
Source: Federal Office for Agriculture and Food, sugar report 2026, table 2[4]. Chart redrawn from the figures in the text.
Limits of the data: Sucrose in white sugar equivalent only, no glucose or fructose syrup. The statistics do not show the wine and sparkling wine or the beer and spirits sectors for 2024/25
Download the chart as an image (PNG)
Show data table7 rows
| 2023/24 (k t) | 2024/25 (k t) | |
|---|---|---|
| Soft drinks, fruit juice, fruit wine | 501.9 | 512.8 |
| Confectionery | 547.7 | 495.1 |
| Other products | 421.7 | 427 |
| Bakery products | 418.7 | 393.3 |
| Ice cream and dairy products | 195.6 | 184.7 |
| Spreads, preserved fruit and vegetables | 128 | 125.9 |
| Cereal products, baking agents | 36.8 | 27.9 |
This figure measures manufacturers’ purchases, not the sugar in the glass. It covers only sucrose, that is ordinary sugar, no glucose or fructose syrup. Whether the drinks are consumed in Germany or exported it does not show.[4] Less sugar per litre and more sugar purchased therefore do not rule each other out. The drinks sector accounts for 23 per cent of the sugar that food manufacturers buy: 512.8 of 2,236.9 thousand tonnes.[4]
4. A rough calculation: how much sugar is in the drinks?
There is no official figure for this. A rough calculation is possible: quantity drunk times average sugar content. The Federal Environment Agency reports consumption for 2024, including imported drinks.[8]
| Segment | Consumption in 2024, million litres | Sugar per 100 ml | Sugar, thousand tonnes |
|---|---|---|---|
| Soft drinks | 11,598 | 5.3 g | around 615 |
| Still juices and nectars | 2,188 | 8.5 to 10.1 g | 186 to 221 |
| Together | 13,786 | around 800 to 836 |
Consumption: Federal Environment Agency, table 1[8]. Sugar content of soft drinks: mean of the Max Rubner Institute across all best-selling soft drinks, with and without sugar[1]. Juices and nectars: range of the values for orange juice and multi-fruit nectar per 100 grams, applied to the litre; per litre the true value is somewhat higher[3].
On this rough calculation the drinks contain around 0.8 million tonnes of sugar. That is more than the 512.8 thousand tonnes that sugar factories and traders sell to the drinks sector. Several reasons contribute to the difference: the fruit sugar in juice is not supplied by any sugar factory, syrup is missing from the statistics, and consumption includes imported drinks. In this rough calculation juices and nectars account for around a quarter of the sugar.
The rough calculation has its limits. No official statistics report cola separately; a calculation by type is therefore not possible with official figures. Beer mixes are missing because there is no official sugar value for them. The institute’s mean covers 76.9 per cent of the market, not all drinks.[1]
Disclosure: the publisher of Die Aufrechte Lupe, Andreas W. Herb, is CEO of the MBG Group. By his own account the group of companies is reformulating drinks recipes and is itself affected by the planned tax. His opinion on it is set out in the essay “Die Steuer, die sich selbst widerlegt”.
METHOD
Method
The sugar contents of soft drinks are means of the best-selling products weighted by sales volume, from the product monitoring of the Max Rubner Institute. The values for juices and nectar come from the German nutrient database and relate to 100 grams.
The sales figures of the Federal Office for Agriculture and Food for 2024/25 are provisional and published to the nearest hundred tonnes. For wine and sparkling wine as well as beer and spirits the statistics keep the 2024/25 values confidential; we do not derive them.
The rough calculation in section 4 combines consumption according to the Federal Environment Agency with the average sugar contents. It shows an order of magnitude, not an official quantity.
Legal status: the tax is planned, and the finance ministry’s draft has not been officially published. Details may change.
CHECK
What was checked before publication
- Every value was checked against the original table on 10 October 2026. Changes, shares and the rough calculation in section 4 are our own.
- The finance ministry’s draft does not exist officially. Statements about it come from a media report (source 7).
- The charts have been redrawn from the tables in the sources; the data tables below them contain the same values.
SOURCES
Sources
Every number in the text leads to its source. The origin is given at each entry: official, media report, trade association, institute or data portal. Titles stay in the original language, so that each document can still be found.
[1] Max Rubner-Institut, 02.07.2025
Ergebnisbericht Produktmonitoring 2024, Tabellen 17 und 18Official source↑ back to the text
[2] Bundesministerium für Landwirtschaft, Ernährung und Heimat, 02.07.2025
Zwischenbilanz: Weniger Zucker, Fette und Salz in verarbeiteten LebensmittelnOfficial source↑ back to the text
[3] Max Rubner-Institut
Bundeslebensmittelschlüssel 4.0, Einträge Apfelsaft (F110600), Orangensaft (F603600) und Mehrfruchtnektar (F012700)Official source↑ back to the text
[4] Bundesanstalt für Landwirtschaft und Ernährung, Juni 2026
Bericht zur Markt- und Versorgungslage Zucker 2026, Abschnitt 3.1.2, Abbildung 15 und Tabelle 2Official source↑ back to the text
[5] FinanzKommission Gesundheit, 30.03.2026
Erster Bericht, Reformempfehlung Nr. 66 (Fassung vom 01.06.2026)Official source↑ back to the text
[6] Deutscher Bundestag, 03.06.2026
Antwort der Bundesregierung auf eine Kleine Anfrage, Drucksache 21/6290Official source↑ back to the text
[7] Deutsches Ärzteblatt, 30.09.2026
Bundesregierung rechnet mit Einnahmen aus Steuer auf Zuckergetränke ab Sommer 2027Media report↑ back to the text
[8] Umweltbundesamt (Studie der GVM), Juli 2026
Bundesweite Erhebung von Daten zum Verbrauch von Getränken in Mehrweggetränkeverpackungen, Bezugsjahr 2024, TEXTE 100/2026, Tabelle 1Official source↑ back to the text
CORRECTIONS
Corrections
No corrections since publication on 10/10/2026. Every substantive change appears here with its date, reason and previous wording.