OPINIONCOMMENTARYTAX REVENUE AND PUBLIC DEBT
989.8 billion euros of taxes – and the federal government is still planning a good 200 billion in new debt
In 2025 the federal government, the Länder and the municipalities took in more tax than ever before. After deducting price increases it is a quarter more than in 2008. A commentary on why the money is said not to be enough all the same, and on who runs the budget.
By Andreas W. Herb, Founder and CEO MBG Group, Paderborn
5 minutes read11 sources1 correctionDisclosure
Share
Contents
€989.8bn
tax revenue in 2025
federal government, Länder, municipalities and the EU’s share[1]
+76.4%
more than in 2008
then 561.2 billion euros[1]
+25.7%
after deducting price increases
a good €200bn
new federal borrowing in 2027
government draft, including special funds[5]
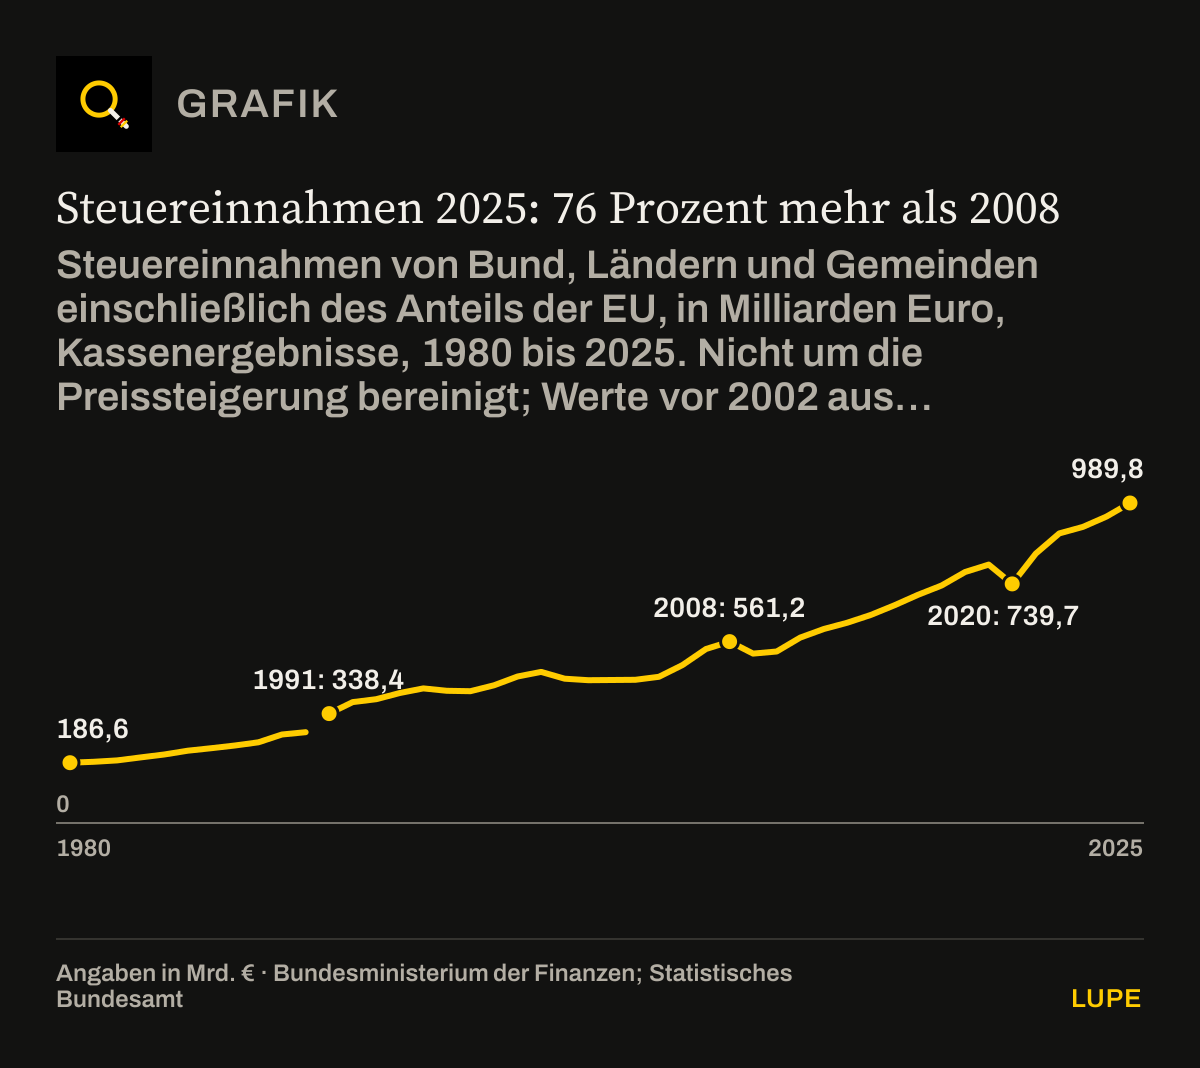
In 2025 the federal government, the Länder and the municipalities took in 989.8 billion euros in taxes, more than ever before in euro terms. In 2008 it was 561.2 billion. That is 428.6 billion euros, or 76.4 per cent, more.[1]
Even so, the federal government is planning a good 200 billion euros of new borrowing for 2027.[5] And even so, every budget debate says the money is not enough for what is needed. I consider that the wrong question. The money is there. The question is where it goes.
More money, even after deducting prices
Anyone calculating fairly deducts prices. Consumer prices rose by 40.3 per cent from 2008 to 2025.[2][3] After deducting that inflation, 25.7 per cent more tax revenue remains than in 2008. So the state does not merely have more euros. In real terms it has a quarter more money at its disposal.
Tax revenue in 2025: 76 per cent more than in 2008
Tax revenue of the federal government, the Länder and the municipalities including the EU’s share, in billions of euros, cash results, 1980 to 2025. Not adjusted for price increases; values before 2002 converted from deutschmarks
- 1980 to 1990: former federal territory
- from 1991: Germany
Federal Ministry of Finance[1][10]; Federal Statistical Office[11]. Chart redrawn from the figures in the text.
Limits of the data: Up to 1990 the former federal territory, from 1991 Germany; the two lines are therefore not joined. Since 1996 child benefit has been set off against wage tax and reduces the revenue reported; the fall in 1996 goes back to that, not to lower taxes. The slumps in 2009 and 2020 fall in the years of the financial crisis and the coronavirus pandemic. Values before 2002 are converted at the fixed rate of 1.95583 deutschmarks to the euro.
Download the chart as an image (PNG)
Show data table46 rows
| 1980 to 1990: former federal territory (€bn) | from 1991: Germany (€bn) | |
|---|---|---|
| 1980 | 186.6 | – |
| 1981 | 189.3 | – |
| 1982 | 193.6 | – |
| 1983 | 202.8 | – |
| 1984 | 212 | – |
| 1985 | 223.5 | – |
| 1986 | 231.3 | – |
| 1987 | 239.6 | – |
| 1988 | 249.6 | – |
| 1989 | 273.8 | – |
| 1990 | 281 | – |
| 1991 | – | 338.4 |
| 1992 | – | 374.1 |
| 1993 | – | 383 |
| 1994 | – | 402 |
| 1995 | – | 416.3 |
| 1996 | – | 409 |
| 1997 | – | 407.6 |
| 1998 | – | 425.9 |
| 1999 | – | 453.1 |
| 2000 | – | 467.3 |
| 2001 | – | 446.2 |
| 2002 | – | 441.7 |
| 2003 | – | 442.2 |
| 2004 | – | 442.8 |
| 2005 | – | 452.1 |
| 2006 | – | 488.4 |
| 2007 | – | 538.2 |
| 2008 | – | 561.2 |
| 2009 | – | 524 |
| 2010 | – | 530.6 |
| 2011 | – | 573.4 |
| 2012 | – | 600 |
| 2013 | – | 619.7 |
| 2014 | – | 643.6 |
| 2015 | – | 673.3 |
| 2016 | – | 705.8 |
| 2017 | – | 734.5 |
| 2018 | – | 776.3 |
| 2019 | – | 799.3 |
| 2020 | – | 739.7 |
| 2021 | – | 833.2 |
| 2022 | – | 895.7 |
| 2023 | – | 915.8 |
| 2024 | – | 947.7 |
| 2025 | – | 989.8 |
Measured against economic output the rise is smaller. According to the public finance statistics the tax ratio stood at 20.3 per cent in 2010 and at 21.9 per cent in 2024.[4] So the tax burden has not risen abruptly. Taxes have grown with the economy and somewhat faster than it. For my argument that is enough: in real terms the state takes in considerably more than it did seventeen years ago.
Grown most strongly: the Länder and the municipalities
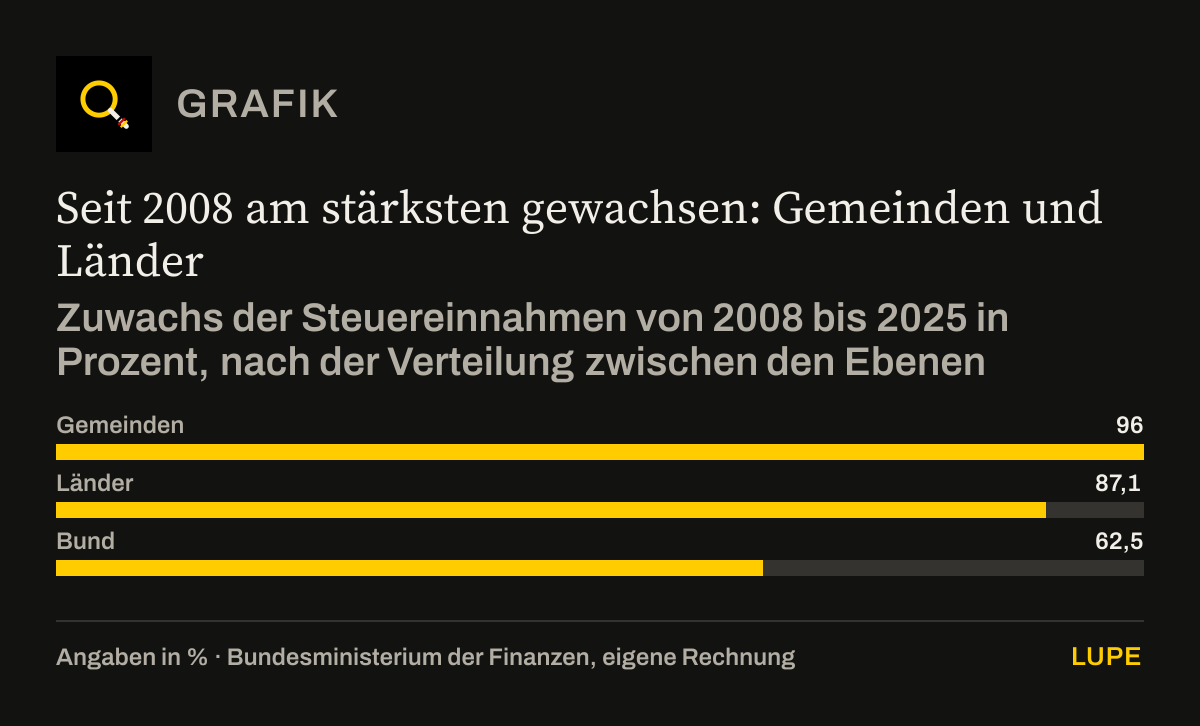
The obvious objection is that little of this reaches the federal government. That is only partly true. Federal tax revenue has risen by 62.5 per cent since 2008, that of the Länder by 87.1 per cent and that of the municipalities by 96.0 per cent.[1] The Länder and the municipalities are the levels that pay for schools, day-care centres and most of the police.
Grown most strongly since 2008: municipalities and Länder
Increase in tax revenue from 2008 to 2025 in per cent, by distribution between the levels of government
Federal Ministry of Finance, own calculation[1]. Chart redrawn from the figures in the text.
Limits of the data: Municipalities 77.0 to 150.9, Länder 221.9 to 415.3, federal government 239.2 to 388.7 billion euros. The federal government and the Länder after the federal supplementary grants. The EU’s share (34.9 billion euros in 2025) is not shown.
Download the chart as an image (PNG)
Show data table3 rows
| Increase 2008 to 2025 (%) | |
|---|---|
| Municipalities | 96 |
| Länder | 87.1 |
| Federal government | 62.5 |
The money has arrived there too. Today 298,000 people work in municipal day-care centres, more than twice as many as in 2008. In the police it is 51,800 more.[7] So it is not the case that nothing is spent on childcare and internal security. All the more pressing is the question of why, with this revenue, the state needs new debt on this scale.
Where the money goes
The state’s largest single item is social benefits, around 52 per cent of all public spending; their share has hardly changed in ten years.[8] On top of that comes staff: since 2008, 970,000 more people have been working in the public service. I broke that down in my commentary 970,000 more in the public service since 2008.
For 2027 the federal government intends to spend 555.4 billion euros. In the core budget 118.7 billion euros of new borrowing are provided for, after a planned 98 billion this year. Including the borrowing of the special funds for infrastructure, climate neutrality and the armed forces it comes to a good 200 billion euros. By 2030 annual net new borrowing is to rise to 219.5 billion euros.[5]
Who runs the budget
Responsible for this draft is finance minister Lars Klingbeil. He introduced it in the Bundestag in September.[6] His biography names a degree in political science, work in members’ offices, a post as the SPD’s youth education officer, a Bundestag seat since 2009 and the offices of general secretary and chairman of his party. The finance ministry is his first government office.[9]
That breaks no rule, and a minister does not have to be a businessman. But in any company one would expect a chief financial officer to have been responsible at some point for a budget of their own that they had to live within. I consider that experience a precondition one may expect of a finance minister. That is my assessment, not a fact.
What I expect
With revenue that in real terms is a quarter above that of 2008, the question is not where more money is to come from. The question is which spending falls away. Before the federal government takes on new borrowing, it ought to show what it has cut. And new taxes belong inside that calculation, not on top of it.
Andreas W. HerbFounder and CEO MBG Group, Paderborn
What I expressly do not claim
Taxes have not risen abruptly: in relation to economic output they have risen only slightly. The 76.4 per cent is an amount in euros, without deducting prices. The borrowing of a good 200 billion euros is planned and not adopted, and a large part of it is earmarked for infrastructure and the armed forces. The tax revenue belongs to all levels of government, while the borrowing concerns the federal government only. I do not claim that no money is spent on day-care centres and the police; the staffing figures show the opposite. That a finance minister without previous government office manages money worse is my assessment and is not documented.
METHOD
Method
1980 to 1999 according to table 6.1.12 of the federal finance ministry’s monthly report of February 2025, in billions of euros; 2000 to 2025 according to the ministry’s time series. Both count the same thing, and for 2000 to 2023 the values are identical. For 2024 and 2025 the monthly report still gives estimates; what is used here are the cash results from the time series. Cross-check for 1980: 364,916.0 million deutschmarks according to the Federal Statistical Office, divided by 1.95583, gives 186.6 billion euros.
Total tax revenue according to the federal finance ministry’s time series, in millions of euros: 2008 561,182, 2025 989,827. 989,827 ÷ 561,182 = 1.764, that is plus 76.4 per cent; the difference comes to 428,645 million euros.
Prices: consumer price index 2025 = 121.9 (2020 = 100). For 2008 the long series gives 91.9 on the basis 2015 = 100; converted via the value for 2020 (105.8) that is 91.9 ÷ 105.8 × 100 = 86.9. 121.9 ÷ 86.9 = 1.403, that is plus 40.3 per cent. In real terms: 1.764 ÷ 1.403 = 1.257, that is plus 25.7 per cent.
Levels of government, according to the distribution of tax revenue and, for the federal government and the Länder, after the federal supplementary grants, in billions of euros: federal government 239.2 to 388.7 (plus 62.5 per cent), Länder 221.9 to 415.3 (plus 87.1 per cent), municipalities 77.0 to 150.9 (plus 96.0 per cent). The remainder is the EU’s share, 34.9 billion euros in 2025. The percentages are calculated from the unrounded values.
Tax ratio according to the public finance statistics, that is cash tax revenue as a percentage of gross domestic product: 2010 20.3, 2024 21.9. For 2008 and 2025 the table shows no value. On the national accounts definition it is 21.7 and 23.0 per cent.
Day-care centres and police from the Destatis time series as at 30 June (values in thousands): municipal day-care centres 136.6 to 298.0, police 307.0 to 358.8. The value for 2025 is provisional.
CHECK
What was checked before publication
- The tax revenue figures were checked on 24 October 2026 against the time series of the federal finance ministry, the prices against the consumer price index of the Federal Statistical Office, the tax ratio against the 2026 data collection on tax policy. The key figures in the author’s draft (561.2 and 989.8 billion euros, plus 76.4 per cent) are correct.
- Like the draft, the chart reaches back to 1980. The values up to 1999 come from the federal finance ministry’s monthly report and have been checked against the Federal Statistical Office’s volumes on the tax budget; they agree to one decimal place. Up to 1990 they apply to the former federal territory and therefore appear as a line of their own. The fall in 1996 is a break in the method of counting, not a fall in taxes; the chart says so.
- The draft spoke of steadily and strongly rising tax revenue. That holds when calculated in euros. After deducting prices it is 25.7 per cent more, and in relation to economic output taxes have risen only slightly. The text says both.
- The draft said there was no money for childcare and internal security. The staffing figures show the opposite: more than twice as many people work in municipal day-care centres as in 2008, and the police have 51,800 more. The text says so.
- The borrowing figures for 2027 come from the government draft as ZDF reproduced it on the day of the cabinet decision. We have not recalculated the draft itself; the Bundestag is to adopt the budget in November and usually changes it in the process.
- That Klingbeil held no government office before his present one appears in the federal government’s biography of him. Whether he therefore manages money differently is the author’s assessment and is marked as such. The federal government and the finance ministry were not asked for comment.
SOURCES
Sources
Every number in the text leads to its source. The origin is given at each entry: official, media report, trade association, institute or data portal. Titles stay in the original language, so that each document can still be found.
[1] Bundesministerium der Finanzen, Stand 2026
Entwicklung der Steuereinnahmen: historische Zeitreihen (Steuereinnahmen nach Gebietskörperschaften 2000 bis 2025)Official source↑ back to the text
[2] Statistisches Bundesamt (Destatis), Stand 13.10.2026
Verbraucherpreisindex für Deutschland, 2020 = 100, JahresdurchschnitteOfficial source↑ back to the text
[3] Statistisches Bundesamt (Destatis), 17.01.2023
Verbraucherpreisindizes für Deutschland – Lange Reihen ab 1948 (2015 = 100)Official source↑ back to the text
[4] Bundesministerium der Finanzen, 2026
Datensammlung zur Steuerpolitik, Ausgabe 2026 (Tabelle 1.1: Steuer-, Staats- und Abgabenquote, S. 7)Official source↑ back to the text
[5] ZDFheute, 06.07.2026
Haushalt 2027: Mehr Schulden und höhere AusgabenMedia report↑ back to the text
[6] ZDFheute, 08.09.2026
Klingbeil legt Etatpläne 2027 im Bundestag vor: Die EckpunkteMedia report↑ back to the text
[7] Statistisches Bundesamt (Destatis), Stand 22.06.2026
Entwicklung der Beschäftigten des öffentlichen Dienstes nach ausgewählten Aufgabenbereichen, Stichtag 30. Juni (Zeitreihe 2006 bis 2025)Official source↑ back to the text
[8] Statistisches Bundesamt (Destatis), 15.01.2026
Statement zur Pressekonferenz „Bruttoinlandsprodukt 2025 für Deutschland“ (Staatsausgaben, Anteil der Sozialleistungen)Official source↑ back to the text
[9] Die Bundesregierung, Stand 24.10.2026
Lars Klingbeil: LebenslaufOfficial source↑ back to the text
[10] Bundesministerium der Finanzen, Stand Oktober 2024
Monatsbericht Februar 2025, Tabelle 6.1.12: Steueraufkommen nach Steuergruppen (1950 bis 2023, ab 2024 Schätzung)Official source↑ back to the text
[11] Statistisches Bundesamt, 1998
Fachserie 14, Reihe 4: Steuerhaushalt, 4. Vierteljahr und Jahr 1997 (Erläuterung zum von der Lohnsteuer abgesetzten Kindergeld ab 1996; Gegenprobe der Werte 1980 bis 1999 in den Heften der Jahre 1980 bis 2000)Official source↑ back to the text
CORRECTIONS
Corrections
What was wrong: Nothing. The chart showed tax revenue only from 2000 onwards, while the author’s draft reached back to 1980.
What was changed: The chart now shows 1980 to 2025, up to 1990 for the former federal territory and from 1991 for Germany, as separate lines. Added to this is a note that the fall in 1996 goes back to child benefit being set off against wage tax. The text and figures of the commentary are unchanged.
Why: At the author’s request, so that the chart shows the long development as his draft did.
This page is opinion. Our fact checks are not.