OPINIONCOMMENTARYSTATE SPENDING RATIO AND BUREAUCRACY
The state is growing. We pay the bill.
The state spending ratio is back above 50 per cent, 5.48 million people work in the public service, and the year’s biggest relief concerns costs nobody has yet paid. Four checked figures for a debate in which many false ones are circulating.
By Andreas W. Herb, Founder and CEO MBG Group, Paderborn
8 minutes read8 sources0 correctionsDisclosure
Share
Contents
50.3%
state spending ratio 2025
above 50 per cent again for the first time since 2021[1]
5,475,100
employees in the public service
reference date 30 June 2025, provisional[4]
€45m
relief for business in compliance cost
reporting period July 2025 to June 2026[8]
+€1.3bn
new bureaucracy costs in the same period
almost thirty times the relief[8]
Germany ought to ask itself a simple question: how much state do we need, and how much of it actually makes our lives better? Anyone demanding new taxes, additional posts and further rules has to explain what measurable benefit citizens and companies get for them. A good purpose is not yet proof of a good instrument.
This debate is conducted with many figures that are wrong. For this piece I have recalculated four indicators against their sources. One of them I had to correct against my own draft.
Above half: a spending ratio, not a performance record
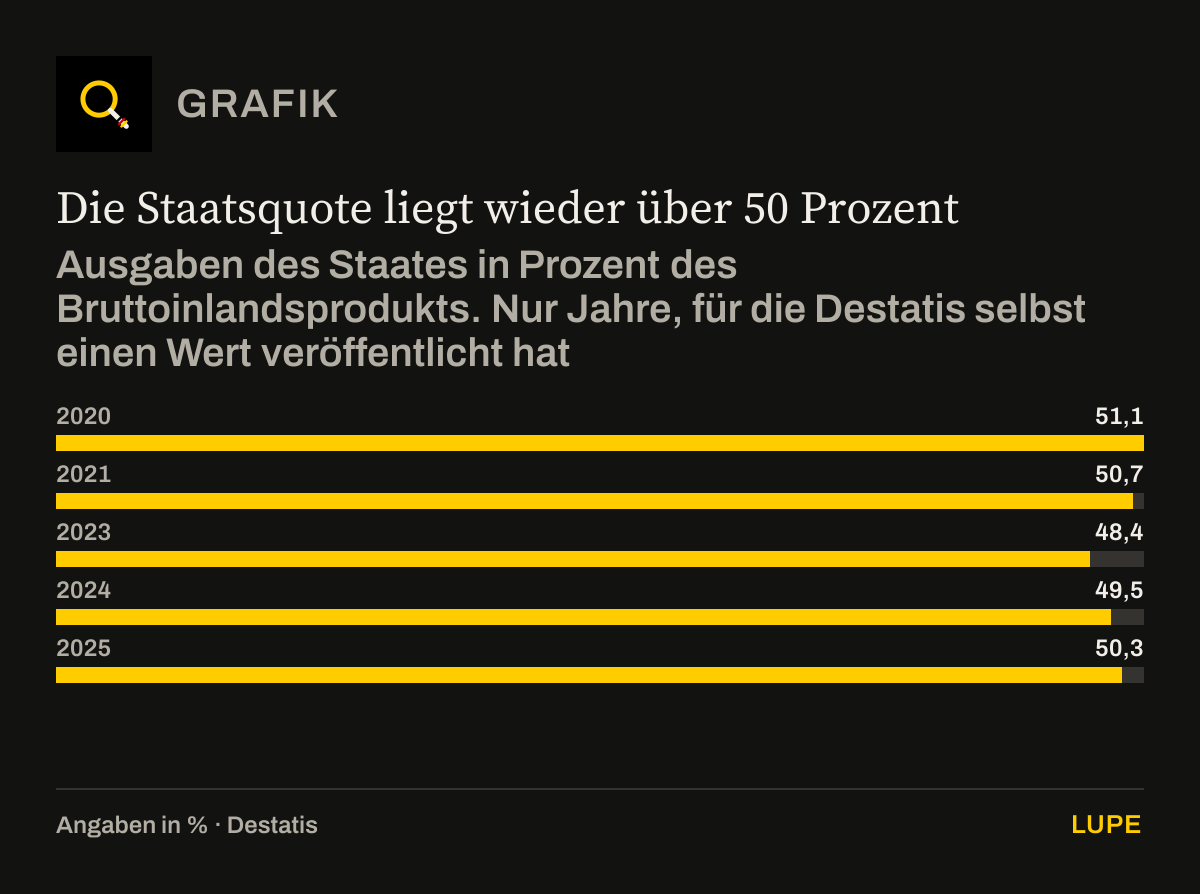
In 2025 the state spending ratio stood at 50.3 per cent and thus rose above 50 per cent for the first time since the coronavirus years 2020 and 2021.[1] What is meant is the total spending of the federal government, the Länder, the municipalities and social insurance in relation to gross domestic product[3] – not the share of people who work for the state, and not the share the state takes from each individual’s income. In euros that is 2,249 billion, 5.1 per cent more than the year before.[2]
The state spending ratio is back above 50 per cent
State spending as a percentage of gross domestic product. Only years for which Destatis has itself published a value
Destatis[1][3]. Chart redrawn from the figures in the text.
Limits of the data: For 2022 no Destatis publication with the annual value could be found; the federal finance ministry reports 48.6 per cent. We leave the gap open rather than mixing two sources in one series. The average of the years 1991 to 2024 is 47.3 per cent, the highest value in 1995 was 55.2 per cent. For 2026 there is as yet no annual value.
Download the chart as an image (PNG)
Show data table6 rows
| State spending ratio (%) | |
|---|---|
| 2020 | 51.1 |
| 2021 | 50.7 |
| 2022 | – |
| 2023 | 48.4 |
| 2024 | 49.5 |
| 2025 | 50.3 |
This is the point at which I had to correct my own draft. It relied on a data series obtained via a financial data provider and gave 50.5 per cent for 2025, 49.4 for 2024 and 48.1 for 2023. The official result is 50.3, 49.5 and 48.4 per cent. The deviations are small. But anyone who demands accuracy of politicians has to demand it of themselves first.
Such a ratio is not in itself proof that money is being spent badly. It is a good occasion to reverse the burden of proof. It is not only citizens and companies who have to explain how they are to finance still more. The state has to explain why it cannot manage better with what it already claims.
What the ratio does not say: it does not rise in every year – after the high value of 2020 it fell for three years. It does not measure what the state itself produces. And it cannot be raised by adding in numbers of people: adding railway employees does not turn a spending ratio of over 50 per cent into a ratio of over 60 per cent. Employees and spending measure different things. The largest single item, at around 52 per cent of state spending, is social benefits; their share has hardly changed in ten years.[2]
More staff is not yet a better state
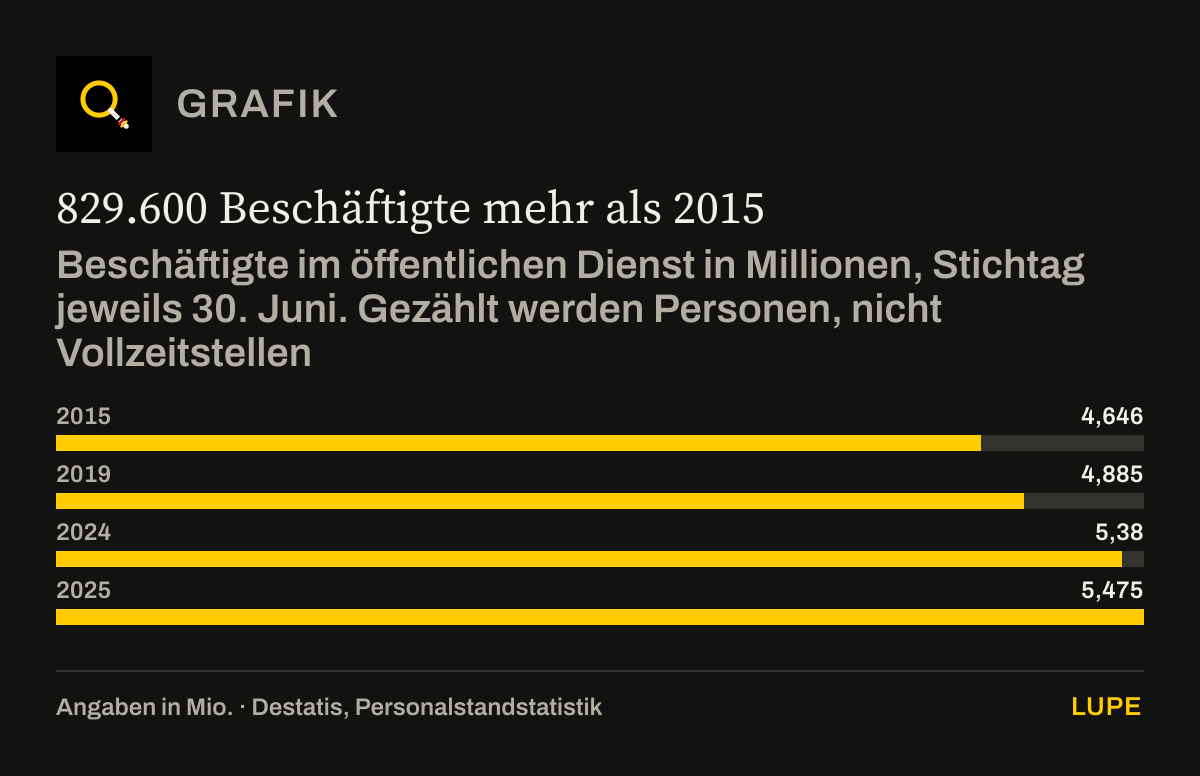
As at 30 June 2025, according to provisional official results, 5,475,100 people were employed in the public service, around 5.5 million. Against the previous year 95,100 were added, 1.8 per cent more.[4] Against 2015 it is 829,600 more, an increase of 17.9 per cent.[5] That is a development across several governments, not a decision of the present federal government.
829,600 more employees than in 2015
Employees in the public service in millions, reference date 30 June in each case. What is counted is people, not full-time posts
Destatis, public service staff statistics[4][5]. Chart redrawn from the figures in the text.
Limits of the data: The value for 2025 is provisional. Included are the federal government, the Länder, the municipalities and social insurance, among them schools, universities, day-care centres and the police.
Download the chart as an image (PNG)
Show data table4 rows
| Employees (m) | |
|---|---|
| 2015 | 4.65 |
| 2019 | 4.88 |
| 2024 | 5.38 |
| 2025 | 5.48 |
Anyone criticising this development ought to know who they mean by it. I have recalculated where the increase since 2015 has gone – and half of it is accounted for by four areas that nobody talks about in the bureaucracy debate:
| Area of responsibility | Increase since 2015 |
|---|---|
| Universities with clinics | +132,600 |
| Schools | +131,600 |
| Municipal day-care centres | +101,000 |
| Police | +47,800 |
| These four together | +413,000 |
| Public service in total | +829,600 |
The four areas account for 413,000 of the 829,600 additional employees, that is 49.8 per cent. They are subsets of the total and do not together make up the overall sum. Note: staff in police training in Hesse have been assigned to universities from 2022; the two series are not fully comparable individually, though their sum is.[5]
Teachers, police officers and childcare workers are no counter-world to the people who produce. They are the part of the state that most citizens actually want. My criticism is aimed at a political reflex: building up staff must not be the standard answer to badly organised processes. Before new administrative posts arise, tasks, responsibilities and processes belong under examination.
The burden does not come only through the tax assessment
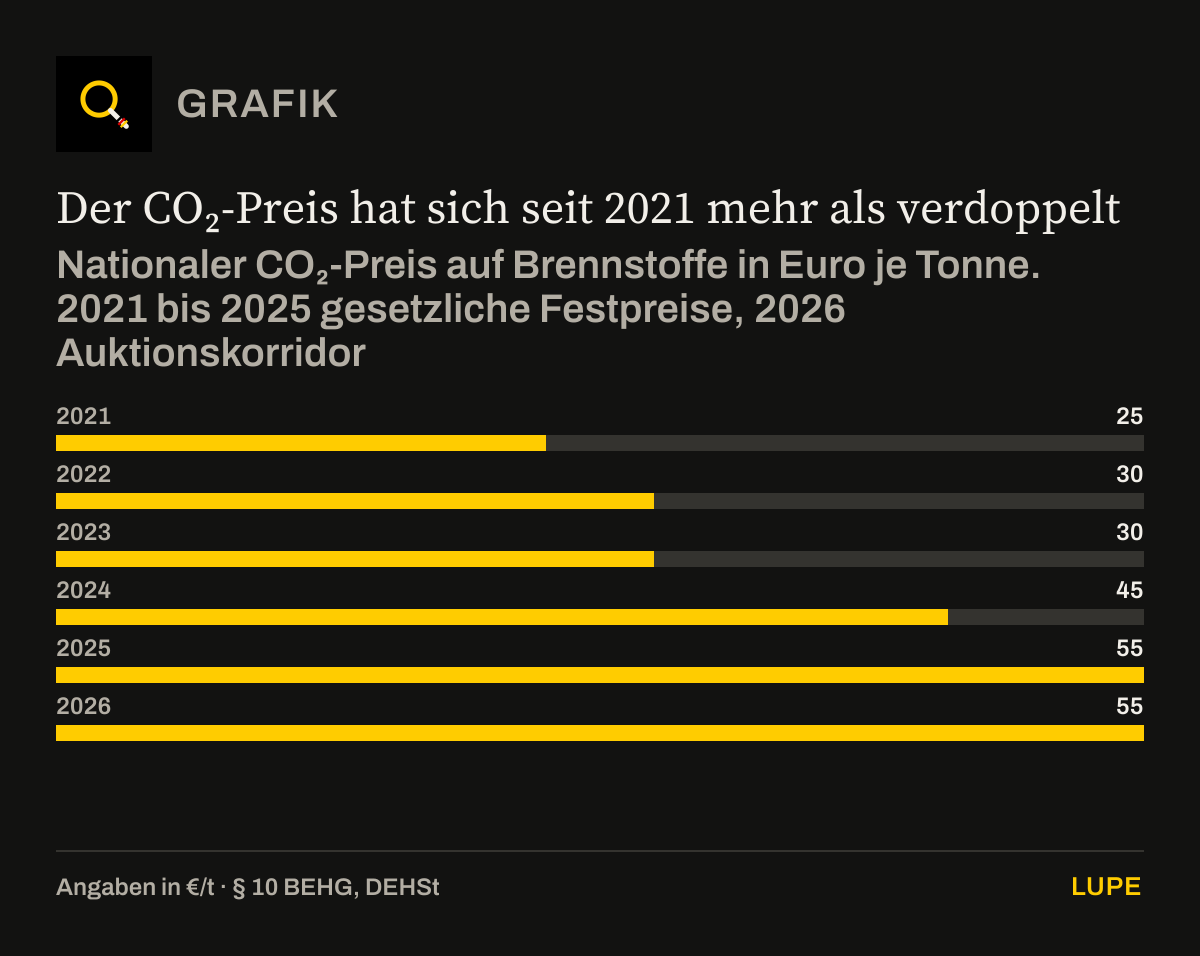
Anyone talking about relief while pointing only at the income tax schedule is not describing the whole bill. The national CO₂ price on fuels is the clearest example: it appears on no tax assessment and nevertheless on every fuel bill and every heating bill.
The CO₂ price has more than doubled since 2021
National CO₂ price on fuels in euros per tonne. 2021 to 2025 statutory fixed prices, 2026 auction corridor
- Fixed price or lower limit
- Upper limit of the corridor
§ 10 BEHG[6], DEHSt[7]. Chart redrawn from the figures in the text.
Limits of the data: For 2026 there is no single annual price: the certificates are auctioned at between 55 and 65 euros, and the subsequent sale is at 68 euros per tonne. These 68 euros are a separate process and are not included in the bar. From 25 to 68 euros is 172 per cent more than in 2021.
Download the chart as an image (PNG)
Show data table6 rows
| Fixed price or lower limit (€/t) | Upper limit of the corridor (€/t) | |
|---|---|---|
| 2021 | 25 | – |
| 2022 | 30 | – |
| 2023 | 30 | – |
| 2024 | 45 | – |
| 2025 | 55 | – |
| 2026 | 55 | 65 |
On 12 August 2026 the cabinet adopted an amendment intended to continue the corridor of 55 to 65 euros in 2027 as well. That is not yet an act.[7] What the CO₂ price means in practice for a single lorry load is set out in the commentary CO₂-Abgaben: Preistreiber mit Ansage. On the planned tax on sugary drinks and the planned plastic packaging tax there are separate reports; both are plans and not taxes already levied in 2026.
Health, climate and environmental goals deserve a serious debate. But even a legitimate goal does not release politics from the duty to disclose effect, distribution and the cost of enforcement. A new burden does not become relief by carrying a name that sounds good.
Reducing bureaucracy: 45 million for business
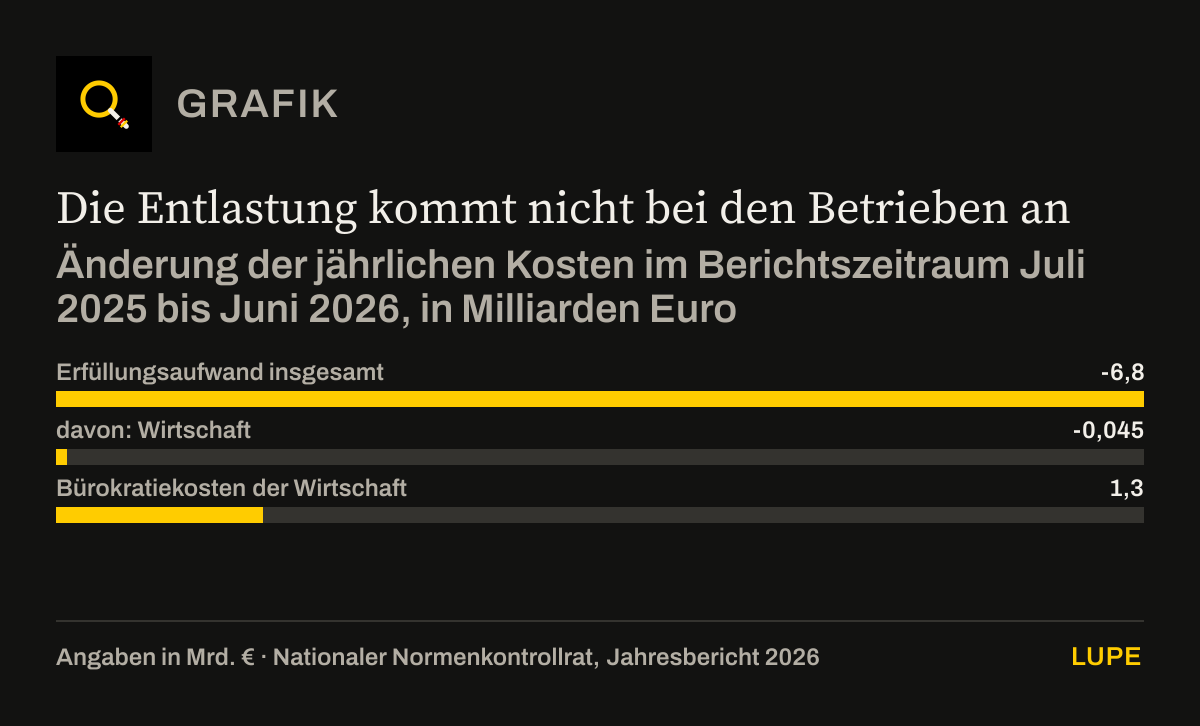
The national regulatory control council presented its annual report on 8 October 2026. The headline from it was: in the reporting period July 2025 to June 2026 the annual compliance cost fell by around 6.8 billion euros, to the lowest level since 2020.[8] That sounds like a turning point. Two sentences later it says how this relief is distributed.
The relief does not reach the businesses
Change in annual costs in the reporting period July 2025 to June 2026, in billions of euros
National regulatory control council, annual report 2026[8]. Chart redrawn from the figures in the text.
Limits of the data: Different, partly overlapping measures: bureaucracy costs are a subset of the annual compliance cost and relate to reporting obligations. The values cannot be added and are not tax revenue for the state.
Download the chart as an image (PNG)
Show data table3 rows
| Change (€bn) | |
|---|---|
| Compliance cost in total | -6.8 |
| of which: business | -0.05 |
| Bureaucracy costs for business | 1.3 |
Of the 6.8 billion euros, around 6.4 billion falls to citizens, around 370 million to the administration and around 45 million to business. In the same period the bureaucracy costs for business rose by 1.3 billion euros, above all through the implementation of the European sustainability reporting obligations.[8] A business that waited for relief in 2026 got 45 million euros spread across every company in the country – and almost thirty times that in new obligations on top.
And the 6.4 billion for citizens is not what it sounds like either. Almost the entire relief – 7.7 billion euros – comes from a single act, the buildings modernisation act, above all from the scrapping of the obligation to run newly installed heating systems on 65 per cent renewable energy. The regulatory control council itself writes about this: considerable future costs would thereby no longer arise, “but no directly noticeable relief arises for those addressed by the rule either, since these costs had not yet been incurred”.[8]
A future burden avoided on paper is not the same as a form that has disappeared today. For a business what counts is not how many billions are saved in a presentation. What counts is whether less working time goes into documentation, whether permits come faster and whether the next investment gets simpler rather than more complicated.
For an assessment in both directions: the regulatory control council nevertheless sees a positive trend. In the reporting period the annual compliance cost has halved across all those affected and still lies 6.4 billion euros above the level of 2011; at the end of the previous reporting period it was 13.2 billion. One-off compliance cost of 8.9 billion euros arose in the same period, however, 6.8 billion of it from the renovation requirements of the same buildings modernisation act.[8] These 6.8 billion are not the 6.8 billion from the headline.
Protect performance rather than inventing new burdens
I do not want a weak state. I want a state that masters its core tasks and respects the people who finance it and work for it. Social protection and economic performance must not be played off against each other.
For that, four standards are needed. First: examine the task before building up staff. New administrative posts only with a comprehensible need, examined processes and measurable goals. Second: a full account rather than a label. Every new levy with a transparent presentation of the tax burden, enforcement, changes to data processing and ongoing effort. Third: relief with proof. Measure the reduction of bureaucracy by which obligations actually fall away and what time comes back in everyday life – not by which future costs have been avoided on paper. Fourth: core tasks first. Education, security, working infrastructure and reliable administration before everything else.
Germany needs no blanket disparagement of its public servants and no invented figures. It needs political leadership that lets itself be measured against a simple rule: before the state demands more, it has to show that it manages better with what it has. A capable state earns trust through results, not through the size of its budget.
Andreas W. HerbFounder and CEO MBG Group, Paderborn
What I expressly do not claim
I do not claim that every public euro is badly spent, that the state spending ratio has risen in every year, or that public service employees do too much or too little. Employee numbers alone prove neither the one nor the other. Three claims circulating in this debate are expressly not supported by the checked data: a state spending ratio of over 60 per cent including railway employees, more than 5.6 million employees in the public service, and a state spending ratio rising without interruption. The political demands in this text are my position, not the statement of the statistics.
METHOD
Method
Increase in staff since 2015, from the Destatis time series as at 30 June (values in thousands): schools 1,069.6 − 938.0 = 131.6; universities 651.3 − 518.7 = 132.6; municipal day-care centres 298.0 − 197.0 = 101.0; police 358.8 − 311.0 = 47.8. Together 413.0 out of a total of 5,475.1 − 4,645.5 = 829.6, that is 49.8 per cent. The total increase in per cent: 829.6 ÷ 4,645.5 = 17.9 per cent.
Ratio of the two regulatory control council measures: 1.3 billion euros ÷ 45 million euros = 28.9. Hence “almost thirty times”. The two measures are not added together or set off against each other; they measure different things and partly overlap.
CO₂ price: 68 ÷ 25 = 2.72, that is 172 per cent more than in 2021. 55 ÷ 25 = 2.2, that is 120 per cent more. The fixed prices up to 2025 and the corridor for 2026 are in the act; the sale price of 68 euros is in the ordinance.
The state spending ratio is the quotient of state spending – federal government, Länder, municipalities and social insurance – and gross domestic product at current prices. The data come from the national accounts and are revised; older publications may therefore differ.
CHECK
What was checked before publication
- All the figures were checked against the primary sources on 21 October 2026: Destatis for the state spending ratio and staffing levels, the fuel emissions trading act and the German Emissions Trading Authority for the CO₂ price, the 2026 annual report of the national regulatory control council for the bureaucracy costs.
- For the state spending ratio the author’s draft cited a Eurostat series obtained via a financial data provider, with 48.1 per cent for 2023, 49.4 for 2024 and 50.5 for 2025. Destatis gives 48.4, 49.5 and 50.3 per cent. This report uses the Destatis values throughout. The draft’s values for 2019 and 2022 have not been taken over, because no Destatis publication could be found for them.
- The staffing level as at 30 June 2025 is a provisional official result. What is counted is people, not full-time posts. No annual value for 2026 is available and none is claimed here.
- The breakdown of the increase in staff since 2015 and the comparison of the two regulatory control council measures are our own calculations from the official data; the arithmetic is set out under “How we calculated”.
- Not checked and therefore not included: the draft’s tax table on the tax on sugary drinks, the plastic packaging tax and alcohol duty. There are separate reports on these measures. The federal government and the regulatory control council were not asked for comment.
SOURCES
Sources
Every number in the text leads to its source. The origin is given at each entry: official, media report, trade association, institute or data portal. Titles stay in the original language, so that each document can still be found.
[1] Statistisches Bundesamt (Destatis), 15.01.2026
Bruttoinlandsprodukt im Jahr 2025 um 0,2 % gewachsen (Pressemitteilung Nr. 017, mit der Staatsquote 2025 von 50,3 %)Official source↑ back to the text
[2] Statistisches Bundesamt (Destatis), 15.01.2026
Statement zur Pressekonferenz „Bruttoinlandsprodukt 2025 für Deutschland“ (Staatsausgaben 2.249 Milliarden Euro, Anteil der Sozialleistungen)Official source↑ back to the text
[3] Statistisches Bundesamt (Destatis), 25.04.2025
Staatsquote 2024 auf 49,5 % angestiegen (Pressemitteilung Nr. N021, mit den Werten für 2020, 2021, 2023 und dem Durchschnitt 1991 bis 2024)Official source↑ back to the text
[4] Statistisches Bundesamt (Destatis), 22.06.2026
Öffentlicher Dienst 2025: Mehr Beschäftigte in der Bildung und Kinderbetreuung (Pressemitteilung Nr. 215)Official source↑ back to the text
[5] Statistisches Bundesamt (Destatis), Stand 22.06.2026
Entwicklung der Beschäftigten des öffentlichen Dienstes nach ausgewählten Aufgabenbereichen, Stichtag 30. Juni (Zeitreihe 2006 bis 2025)Official source↑ back to the text
[6] Bundesministerium der Justiz, Stand 21.10.2026
§ 10 Brennstoffemissionshandelsgesetz (BEHG): Veräußerung der Emissionszertifikate, Festpreise 2021 bis 2025 und Preiskorridor 2026Official source↑ back to the text
[7] Deutsche Emissionshandelsstelle (DEHSt), Stand 21.10.2026
nEHS: Verkauf und Versteigerung (Mindestpreis 55 Euro und Höchstpreis 65 Euro nach § 12 BEHV, Verkaufspreis 68 Euro nach § 14 BEHV, Novelle vom 12.08.2026)Official source↑ back to the text
[8] Nationaler Normenkontrollrat, 08.10.2026
Jahresbericht 2026 (Berichtszeitraum Juli 2025 bis Juni 2026, vorgestellt am 8. Oktober 2026)Official source↑ back to the text
CORRECTIONS
Corrections
No corrections since publication on 21/10/2026. Every substantive change appears here with its date, reason and previous wording.
This page is opinion. Our fact checks are not.