BACKGROUNDCHILDCARE CHECK 2015–2026CHILDCARE
Twice as expensive, barely more places: Paderborn’s childcare absurdity
The cost of childcare has more than doubled since 2015 – from 48.7 to 102.5 million euros. The number of childcare places has grown by only 15 per cent over the same period. And for 2026 the city is even planning 118 places fewer than in 2025 – at costs 3.7 million euros higher.
Basis: analysis of the budget documents of the city of Paderborn, available to the editorial team
4 minutes read6 sources0 corrections
Share
Contents
+110%
childcare expenditure 2015 to 2026
from 48.7 to 102.5 million euros
+15%
places city-wide 2015 to 2026
from 5,233 to 6,024
+83%
cost per place
from 9,306 to 17,014 euros
−118
places in 2026 against 2025
from 6,142 to 6,024
The city of Paderborn today spends more than twice as much on childcare as it did eleven years ago. The number of places has risen by 15 per cent over the same time. For 2026 the city is planning fewer places than for 2025, at higher costs. All the figures in this piece appear in the city’s budget documents; they are public and are linked at the end.[1][2]
The costs: doubled in eleven years
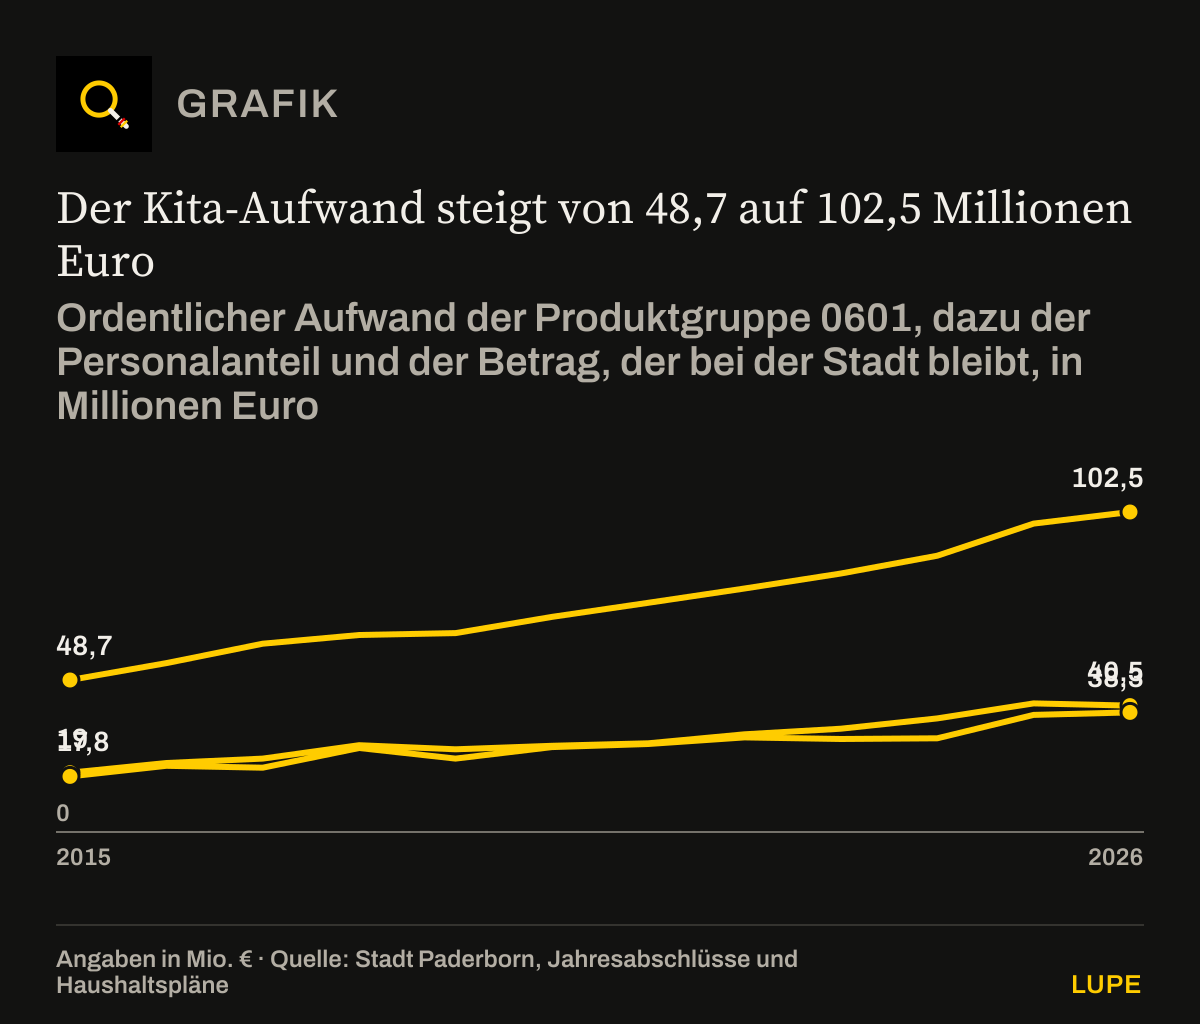
In the childcare part of the budget all the large blocks rise sharply: staff from 19.0 to 40.5 million euros (+114 per cent), grants to independent providers from 27.4 to 57.4 million euros (+109 per cent). What is left with the city after deducting Land funding and parental contributions grows from 17.8 to 38.3 million euros (+115 per cent).[1][2]
Childcare expenditure rises from 48.7 to 102.5 million euros
Ordinary expenditure of product group 0601, together with the staff share and the amount that stays with the city, in millions of euros
- Total expenditure
- of which staff
- The city’s own contribution
Source: city of Paderborn, annual accounts and budget plans[1][2]. Chart redrawn from the figures in the text.
Limits of the data: 2015 to 2024 actuals according to the annual accounts, 2025 and 2026 budget figures. Excluding the childcare buildings, which run through the municipal buildings management operation
Download the chart as an image (PNG)
Show data table12 rows
| Total expenditure (€m) | of which staff (€m) | The city’s own contribution (€m) | |
|---|---|---|---|
| 2015 | 48.7 | 19 | 17.8 |
| 2016 | 54.1 | 22.1 | 21.2 |
| 2017 | 60.3 | 23.5 | 20.6 |
| 2018 | 63.1 | 27.8 | 26.9 |
| 2019 | 63.7 | 26.5 | 23.5 |
| 2020 | 68.9 | 27.6 | 27.2 |
| 2021 | 73.4 | 28.4 | 28.2 |
| 2022 | 78 | 31.3 | 30.3 |
| 2023 | 82.8 | 33.1 | 29.8 |
| 2024 | 88.5 | 36.4 | 30 |
| 2025 | 98.8 | 41.2 | 37.5 |
| 2026 | 102.5 | 40.5 | 38.3 |
The places: first expansion, then standstill, now decline
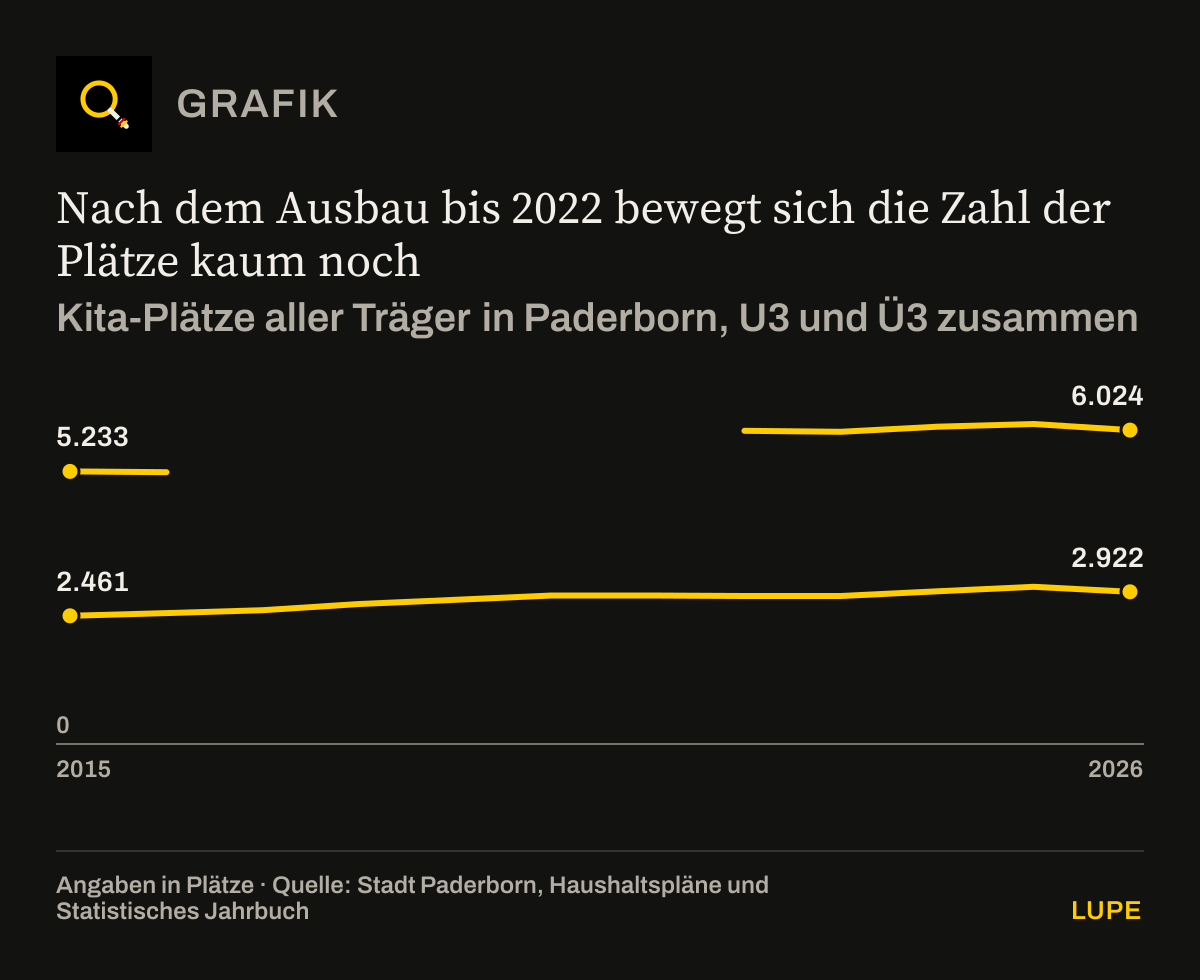
Up to 2022 Paderborn built up around 800 places. Since then the number has been almost standing still: from 6,012 places in 2022 to 6,024 for 2026, an increase of 0.2 per cent. From 2025 to 2026, 118 places disappear, 96 of them in municipal day-care centres. Places for children under three have been falling since 2023, from 1,467 to 1,434.[2][3][5]
After the expansion up to 2022 the number of places barely moves
Childcare places of all providers in Paderborn, U3 and Ü3 together
- Places of all providers
- of which municipal day-care centres
Source: city of Paderborn, budget plans and statistical yearbook[2][3][4][5]. Chart redrawn from the figures in the text.
Limits of the data: 2015, 2016, 2025 and 2026 planned figures, 2022 statistical yearbook, 2023 and 2024 actuals according to the Land settlement. For 2017 to 2021 there is no city-wide figure: between 2016 and 2022 the line joins two measured points, with no value in between. The axis begins at zero, so the slight movement of recent years is barely visible
Download the chart as an image (PNG)
Show data table12 rows
| Places of all providers (Places) | of which municipal day-care centres (Places) | |
|---|---|---|
| 2015 | 5,233 | 2,461 |
| 2016 | 5,217 | 2,513 |
| 2017 | – | 2,568 |
| 2018 | – | 2,688 |
| 2019 | – | 2,768 |
| 2020 | – | 2,851 |
| 2021 | – | 2,851 |
| 2022 | 6,012 | 2,840 |
| 2023 | 5,992 | 2,840 |
| 2024 | 6,091 | 2,930 |
| 2025 | 6,142 | 3,018 |
| 2026 | 6,024 | 2,922 |
Where the absurdity lies
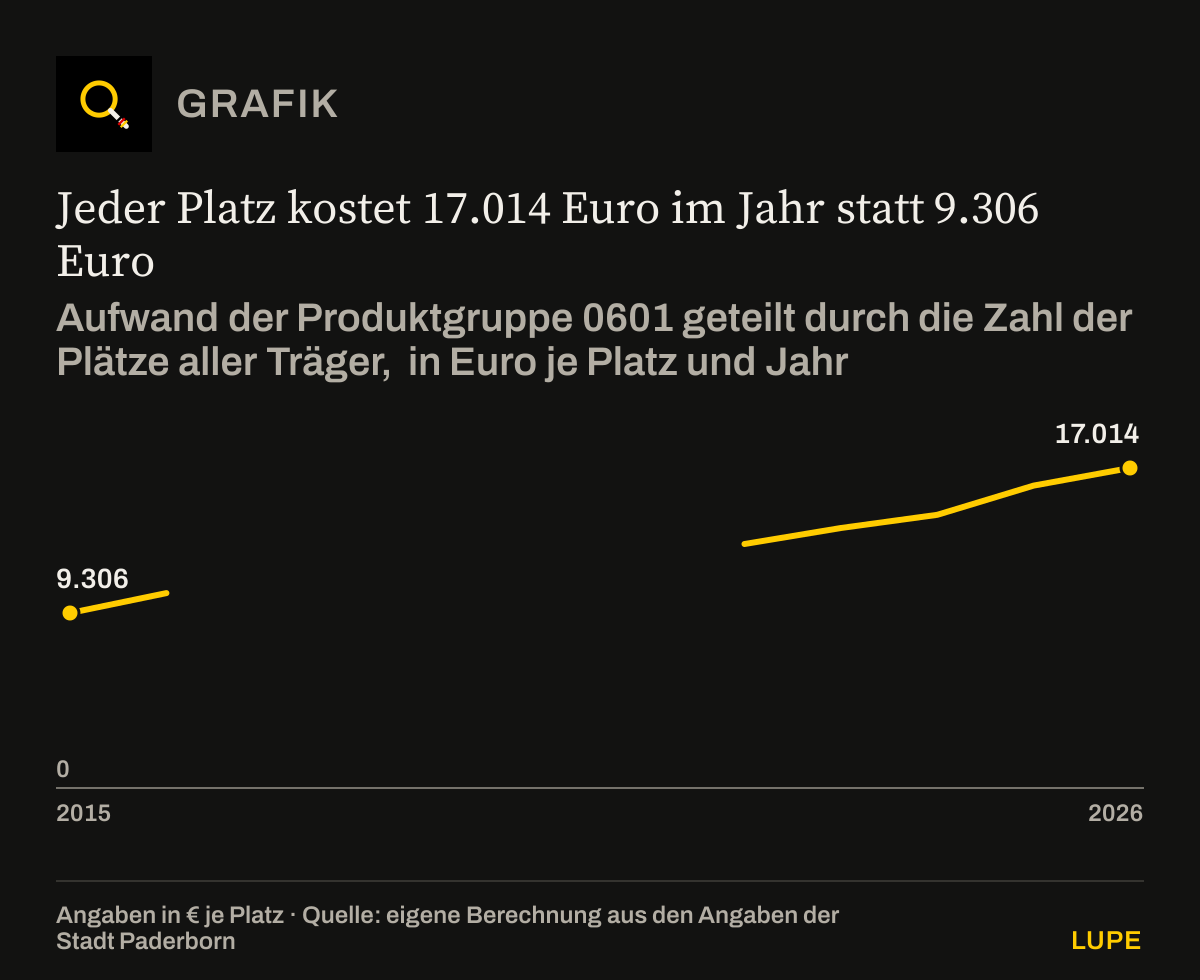
Over the long run the places have not fallen. The gap has been opening since 2022: costs rise by 31 per cent in four years, from 78.0 to 102.5 million euros. The number of places grows over the same time by 0.2 per cent, from 6,012 to 6,024. Per place the city therefore pays 17,014 euros a year today instead of 9,306 euros in 2015.[1][2][3][4][5]
Every place costs 17,014 euros a year instead of 9,306 euros
Expenditure of product group 0601 divided by the number of places of all providers, in euros per place per year
Source: own calculation from the figures of the city of Paderborn[1][2][3][4][5]. Chart redrawn from the figures in the text.
Limits of the data: For 2017 to 2021 the city-wide figure for places is missing, so the value for those years cannot be formed. Between 2016 and 2022 the line joins two measured points, with no value in between
Download the chart as an image (PNG)
Show data table12 rows
| cost per place (€ per place) | |
|---|---|
| 2015 | 9,306 |
| 2016 | 10,362 |
| 2017 | – |
| 2018 | – |
| 2019 | – |
| 2020 | – |
| 2021 | – |
| 2022 | 12,974 |
| 2023 | 13,823 |
| 2024 | 14,528 |
| 2025 | 16,078 |
| 2026 | 17,014 |
All the years at a glance
| Year | Expenditure €m | of which staff | City’s contribution | Places in total | Municipal places | € per place |
|---|---|---|---|---|---|---|
| 2015 | 48.7 | 19.0 | 17.8 | 5,233 | 2,461 | 9,306 |
| 2016 | 54.1 | 22.1 | 21.2 | 5,217 | 2,513 | 10,362 |
| 2017 | 60.3 | 23.5 | 20.6 | – | 2,568 | – |
| 2018 | 63.1 | 27.8 | 26.9 | – | 2,688 | – |
| 2019 | 63.7 | 26.5 | 23.5 | – | 2,768 | – |
| 2020 | 68.9 | 27.6 | 27.2 | – | 2,851 | – |
| 2021 | 73.4 | 28.4 | 28.2 | – | 2,851 | – |
| 2022 | 78.0 | 31.3 | 30.3 | 6,012 | 2,840 | 12,974 |
| 2023 | 82.8 | 33.1 | 29.8 | 5,992 | 2,840 | 13,823 |
| 2024 | 88.5 | 36.4 | 30.0 | 6,091 | 2,930 | 14,528 |
| 2025 (plan) | 98.8 | 41.2 | 37.5 | 6,142 | 3,018 | 16,078 |
| 2026 (plan) | 102.5 | 40.5 | 38.3 | 6,024 | 2,922 | 17,014 |
The places for 2015 and 2016 are planned figures from the 2016 budget. The municipal places for 2015 to 2022 appear in the statistical yearbook, and from 2023 in the budget plan. Places are reported per childcare year, costs per calendar year; the matching is therefore approximate.[1][2][3][4][5]
What now has to happen
The following section is assessment, not finding. It contains demands of this editorial team and no determination by an authority.
Do not save on childcare – but turn every euro into places. Concretely: take administrative work out of the day-care centre through digitalisation and AI, deploy everyday helpers, book care hours according to real need (today around 60 per cent of Ü3 bookings, that is for over-threes, are for 45 hours), fill groups up to the statutory limit, build a cover pool instead of closing groups, retrain administrative staff who become available as childcare assistants.[2]
And above all: measure. The aim would be to stop the decline in 2026 and to create around 8 per cent more places with the existing staff by the 2028/29 childcare year. A large independent provider is already warning that care places will be lost through the city’s savings package.[6]
METHOD
Method
The cost figures are taken from the partial income statement of product group 0601, for 2015 to 2024 as actuals from the annual accounts, for 2025 and 2026 as planned figures from the budget plans.
The cost per place is a calculation of our own: the expenditure of product group 0601 divided by the number of places of all providers in the same year. Where a figure for places is missing, the value is missing too.
The axes of the charts begin at zero. That is the house rule (docs/04-designsystem.md): a truncated axis makes small differences look large. The movement in the number of places therefore looks slight – and that is precisely the finding.
The buildings costs of the day-care centres are not included. They run through the municipal buildings management operation and do not appear in this product group.
CHECK
What was checked before publication
- All the figures come from annual accounts, budget plans and the statistical yearbook of the city of Paderborn. The documents are linked under Sources with their references.
- The editorial team relies on the analysis of these documents that it holds. A recalculation of every individual figure against the city’s original files is still outstanding; anyone finding a discrepancy is asked to report it via “Report an error”.
- Places are reported per childcare year, costs per calendar year. The matching in the table and the charts is therefore approximate, not to the day.
- For 2017 to 2021 no city-wide figures for places are available. Those years are left blank in the charts and in the table; they are not estimated.
- No statement from the city of Paderborn was available at the time of publication.
SOURCES
Sources
Every number in the text leads to its source. The origin is given at each entry: official, media report, trade association, institute or data portal. Titles stay in the original language, so that each document can still be found.
[1] Stadt Paderborn
Jahresabschlüsse 2015 bis 2024, Teilergebnisrechnung Produktgruppe 0601 „Förderung von Kindern in Tagesbetreuung“Official source↑ back to the text
[2] Stadt Paderborn
Haushaltsplan 2026, Band 3: Produktgruppe 0601, Grunddaten Kitas, Plan 2025 und 2026Official source↑ back to the text
[3] Stadt Paderborn
Haushaltsplan 2025, Band III: Grunddaten Kitas, Ist 2023Official source↑ back to the text
[4] Stadt Paderborn
Haushaltsplan 2016, Band II: Grunddaten Kitas, Plan 2015 und 2016Official source↑ back to the text
[5] Stadt Paderborn
Statistisches Jahrbuch 2022, Tabellen 6.5 und 6.6: Plätze städtischer und freier KitasOfficial source↑ back to the text
[6] Neue Westfälische
100-Millionen-Sparpaket in Paderborn: Großer Kita-Träger befürchtet Wegfall von BetreuungsplätzenMedia report↑ back to the text
CORRECTIONS
Corrections
No corrections since publication on 18/10/2026. Every substantive change appears here with its date, reason and previous wording.