BACKGROUNDBUDGET CHECK 2014–2026PADERBORN
The town hall keeps growing: 817 more posts, twice the cost – and nothing budgeted for AI
Since 2014 Paderborn has increased its administration by 57 per cent, more than doubled its staff costs and driven debt per inhabitant by 2026 to 2.6 times the 2019 level. Now budget consolidation is coming. Even so, the 2026 establishment plan again shows more posts than the year before.
Basis: analysis of the budget documents of the city of Paderborn, available to the editorial team
6 minutes read9 sources0 corrections
Share
Contents
+817
posts since 2014
from 1,433 to 2,250
+108%
staff and pension expenditure since 2014
from 87.8 to 182.4 million euros
+9%
inhabitants over the same period
from 145,176 to 158,044
€3,875
debt per inhabitant in 2026
in 2019 it was 1,488 euros
A little more town hall every year
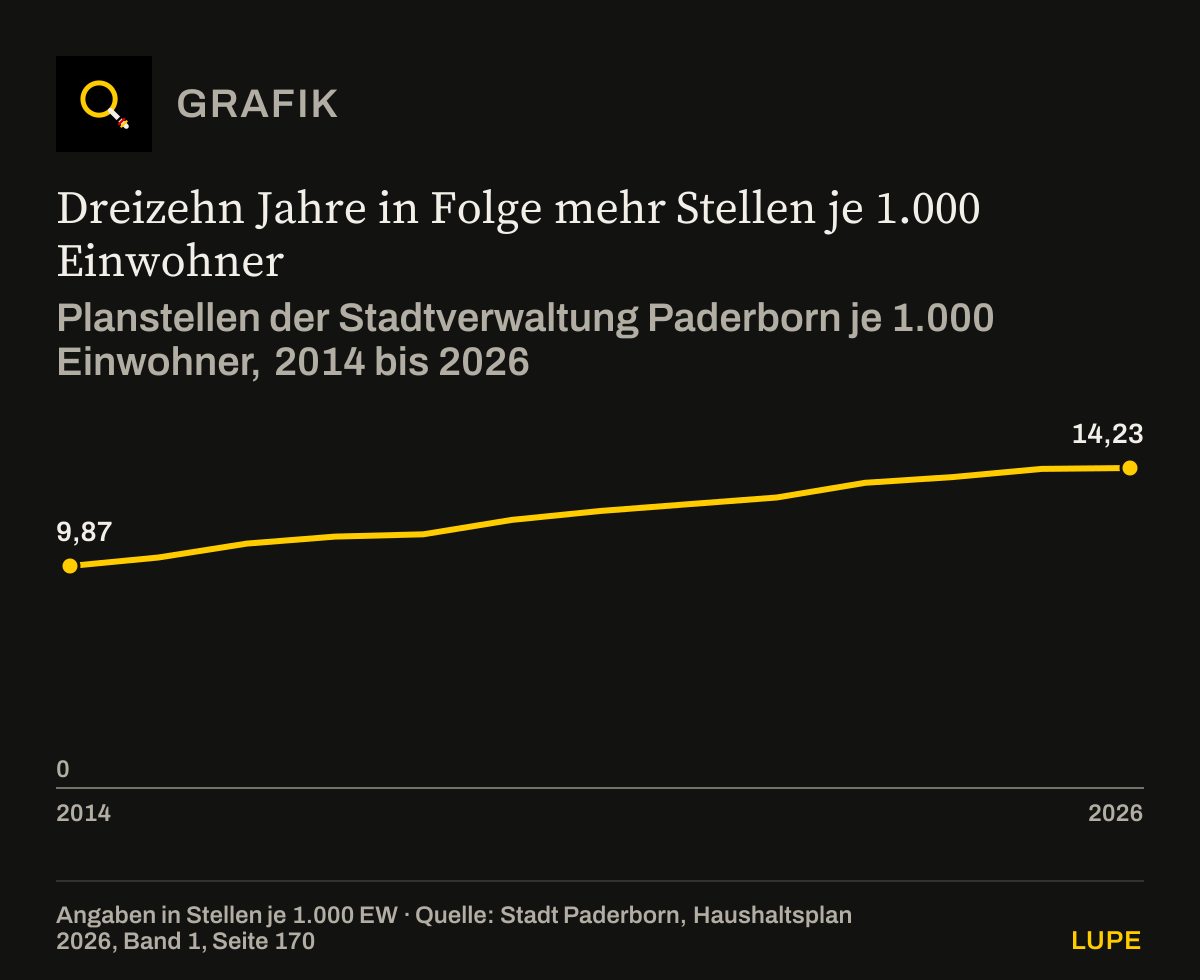
The figures do not come from critics but from the city’s own budget plan.[1] In 2014 there were 9.87 posts in the city administration for every 1,000 Paderborn residents. In 2026 there are 14.23. That is an increase of 44 per cent – and without a single year’s pause: since 2014 the figure has risen every year, thirteen times in a row. The number of posts grew from 1,432.6 to 2,249.6. The population over the same period rose only from 145,176 to a projected 158,044, that is by almost 9 per cent.
Thirteen years in a row with more posts per 1,000 inhabitants
Established posts of the Paderborn city administration per 1,000 inhabitants, 2014 to 2026
Source: city of Paderborn, 2026 budget plan, volume 1, page 170[1]. Chart redrawn from the figures in the text.
Limits of the data: 2025 and 2026 planned; the population figures for those years follow the IT.NRW projection. The axis begins at zero, as in all this publication’s charts
Download the chart as an image (PNG)
Show data table13 rows
| Posts per 1,000 inhabitants (posts per 1,000 inhabitants) | |
|---|---|
| 2014 | 9.87 |
| 2015 | 10.25 |
| 2016 | 10.87 |
| 2017 | 11.18 |
| 2018 | 11.28 |
| 2019 | 11.92 |
| 2020 | 12.32 |
| 2021 | 12.62 |
| 2022 | 12.92 |
| 2023 | 13.57 |
| 2024 | 13.83 |
| 2025 | 14.19 |
| 2026 | 14.23 |
Spending has almost doubled
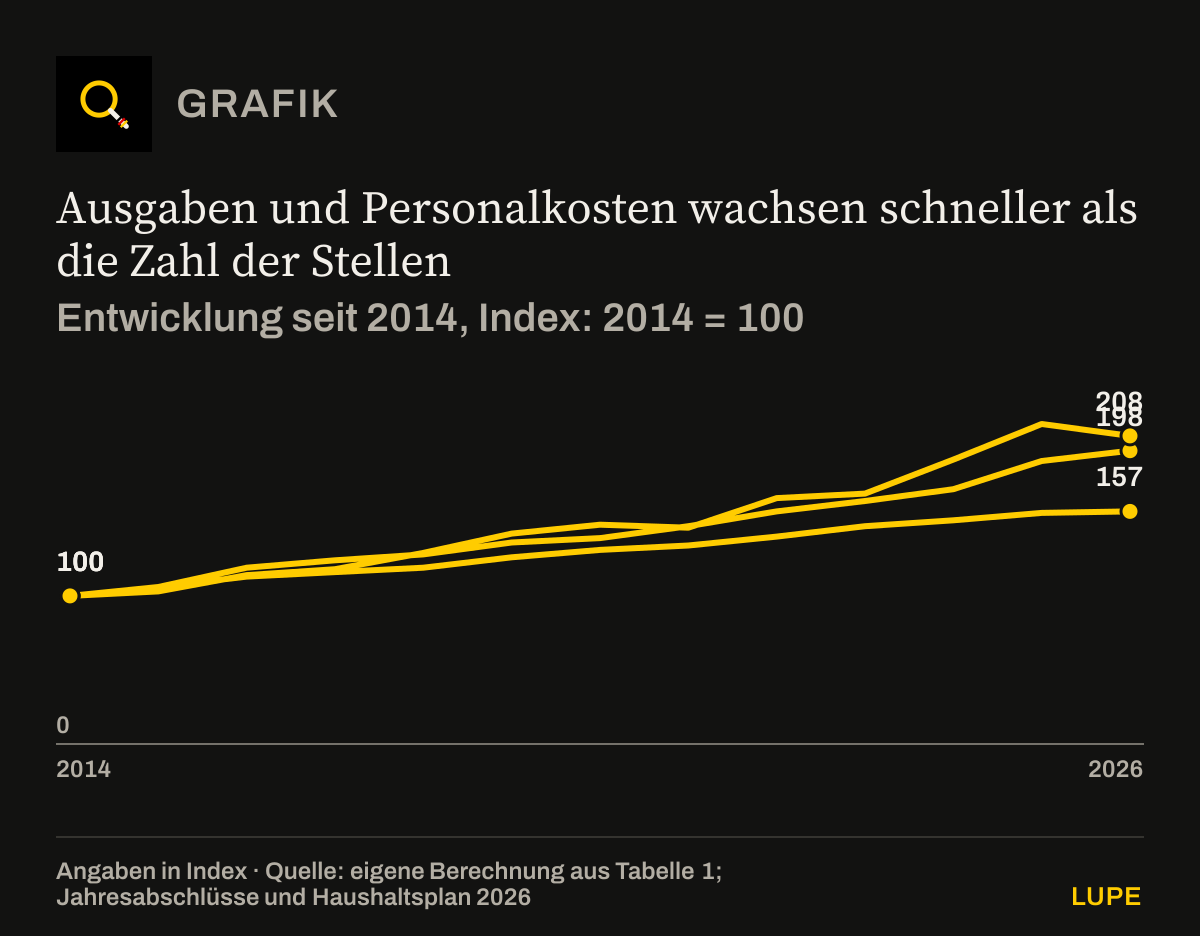
In 2014 the city spent 341 million euros in its operating budget. In 2026 it is to be 674 million euros – an increase of 98 per cent.[1][2] Prices rose by around 30 per cent over the same period.[5] Staff and pension costs grew even more strongly than total spending: from 87.8 to 182.4 million euros, that is by 108 per cent. Per inhabitant that is around 1,154 euros in 2026; in 2014 it was 605 euros.
Spending and staff costs grow faster than the number of posts
Development since 2014, index: 2014 = 100
- Spending
- Staff and pensions
- Posts
Source: own calculation from table 1; annual accounts and 2026 budget plan[1][2]. Chart redrawn from the figures in the text.
Limits of the data: 2025 and 2026 planned figures. Price development is not plotted here: the annual values of the consumer price index are not part of the analysis we hold. For comparison in the text: around 30 per cent price increase over the same period{5}
Download the chart as an image (PNG)
Show data table13 rows
| Spending (Index) | Staff and pensions (Index) | Posts (Index) | |
|---|---|---|---|
| 2014 | 100 | 100 | 100 |
| 2015 | 106 | 103 | 106 |
| 2016 | 119 | 114 | 113 |
| 2017 | 124 | 118 | 116 |
| 2018 | 128 | 129 | 119 |
| 2019 | 136 | 142 | 126 |
| 2020 | 139 | 148 | 131 |
| 2021 | 147 | 146 | 134 |
| 2022 | 157 | 166 | 140 |
| 2023 | 164 | 169 | 147 |
| 2024 | 172 | 192 | 151 |
| 2025 | 191 | 216 | 156 |
| 2026 | 198 | 208 | 157 |
All the years at a glance
| Year | Spending | Revenue | Annual result | Staff + pensions | Posts | posts per 1,000 inhabitants |
|---|---|---|---|---|---|---|
| 2014 | 341.4 | 325.5 | −11.9 | 87.8 | 1,432.6 | 9.87 |
| 2015 | 361.3 | 349.8 | −4.9 | 90.0 | 1,519.0 | 10.25 |
| 2016 | 407.6 | 409.5 | +8.8 | 100.5 | 1,616.5 | 10.87 |
| 2017 | 423.8 | 405.3 | −11.0 | 103.7 | 1,667.1 | 11.18 |
| 2018 | 437.5 | 439.1 | +9.7 | 113.5 | 1,698.8 | 11.28 |
| 2019 | 464.4 | 453.3 | −2.6 | 124.8 | 1,807.1 | 11.92 |
| 2020 | 473.2 | 458.3 | −2.3 | 130.1 | 1,870.6 | 12.32 |
| 2021 | 502.0 | 486.8 | −2.3 | 128.6 | 1,925.0 | 12.62 |
| 2022 | 535.6 | 530.2 | +4.1 | 145.5 | 1,998.7 | 12.92 |
| 2023 | 560.8 | 558.2 | +5.5 | 148.2 | 2,112.9 | 13.57 |
| 2024 | 586.6 | 567.2 | −11.0 | 168.9 | 2,162.1 | 13.83 |
| 2025 (plan) | 651.7 | 575.8 | −56.4 | 189.4 | 2,239.3 | 14.19 |
| 2026 (plan) | 674.5 | 610.0 | −25.9 | 182.4 | 2,249.6 | 14.23 |
| 2014 to 2026 | +98% | +87% | – | +108% | +57% | +44% |
Actuals from the annual accounts for 2014 to 2024, 2025 and 2026 budget figures. The annual result for 2020 to 2024 follows the 2026 preliminary report after isolation of coronavirus effects, and for 2025 and 2026 after deducting the flat-rate reduction requirement. Staff and pensions means staff and pension expenditure including provisions. Posts are established posts according to the establishment plan.[1][2]
Debt: from 1,488 to 3,875 euros per inhabitant
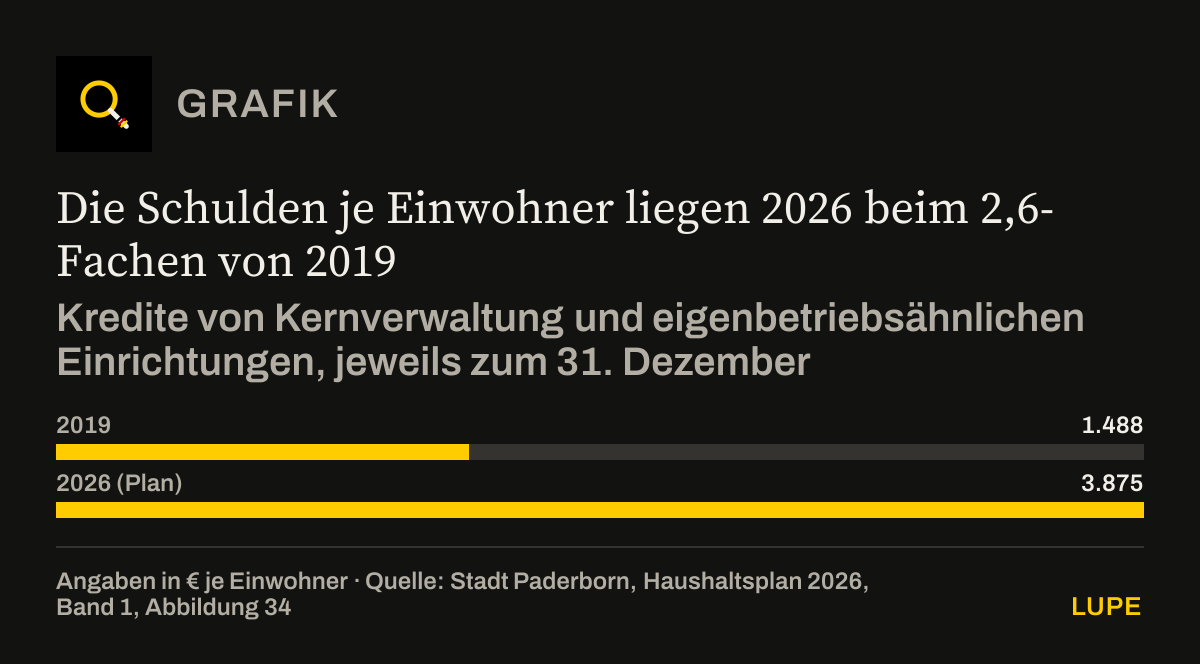
For a long time Paderborn counted as solid. In 2019 the borrowing of the city and its municipal operations stood at 1,488 euros per inhabitant. For the end of 2026 the city plans 3,875 euros – 2.6 times as much.[1]
Debt per inhabitant in 2026 stands at 2.6 times the 2019 level
Borrowing of the core administration and operations run on a municipal enterprise basis, in each case as at 31 December
Source: city of Paderborn, 2026 budget plan, volume 1, figure 34[1]. Chart redrawn from the figures in the text.
Limits of the data: The years in between are not part of the analysis we hold and therefore do not appear in the chart
Download the chart as an image (PNG)
Show data table2 rows
| Debt per inhabitant (€ per inhabitant) | |
|---|---|
| 2019 | 1,488 |
| 2026 (plan) | 3,875 |
Cash credits in the core budget, end of 2019 against end of 2026
€4m → €157.7m
Cash credits are debt used to pay current spending – a municipality’s overdraft. At the end of 2019 it was just under 4 million euros in the core budget; for the end of 2026 the city plans 157.7 million euros, around 40 times as much.[1][2]
At the same time equity is melting away. The city’s reserves are to fall from 665 million euros at the end of 2024 to 454 million euros by 2029, a decline of almost 32 per cent.[1] Without counter-measures the consultants at PD reckon on negative equity from 2032 and minus 544 million euros by 2037.[3]
Budget consolidation – and more posts all the same
According to the budget plan the city and the district agree that a budget consolidation plan from 2027 is “unavoidable”.[1] For 2025 the city was already planning a deficit of 56 million euros – and created 77 additional posts in the same year. In 2026 another 10 posts are added. Spending rises in 2026 to 674 million euros and, according to the financial plan, is to climb to 712 million euros by 2029.[1]
PD proposes cutting around 390 full-time posts by 2037 through natural turnover, spread over eleven years.[3] Since 2019 alone, however, 442 posts have been added.[1] So even if the plan is implemented in full, Paderborn would have more posts in 2037 than in 2019. The report also contains the measure “expanded use of AI” – with a consolidation contribution of “/”. Not a single euro is quantified.[3]
What speaks for the city
Fairness requires this: part of the increase is not in the city’s hands alone. The legal entitlement to childcare places, all-day schooling, the fire protection plan and collective pay settlements drive the costs. The childcare staff alone cost around 40.5 million euros in 2026. PD too wants to exempt day-care centres and the fire service from any reduction of posts.[1][3]
Commentary: in the age of AI, Paderborn is adding posts rather than cutting them
From here on this is assessment, not finding. The commentary, the worked example and the demands set out the view of this editorial team. The figures in them are documented as everywhere else; the conclusions drawn from them are not.
While many companies have long been rebuilding their administration with artificial intelligence, the Paderborn town hall plans in eleven-year steps. Yet assessments of the potential exist: according to McKinsey, generative AI could cut the staff requirement in the public service by up to a third, and local authorities would benefit particularly, it says expressly.[6] With AI agents that handle cases independently, the same firm considers halving the additional staff requirement possible.[7] The Bundestag’s research service points to a study according to which AI can provide support in around 70 per cent of administrative jobs.[8]
In practice little of this happens in local authorities: according to an analysis by the German Economic Institute from 2025, only 0.3 per cent of municipal job advertisements had any reference to AI at all.[9] Paderborn is no exception – in the establishment plan the posts grow, and in the savings plan AI has a slash beside it.
around €50m
if Paderborn had as many posts per inhabitant as in 2014
9.87 per 1,000 inhabitants would be around 1,560 instead of 2,250 posts, about 690 fewer[1][4]
around €14m
if AI took over half the work of internal administration
staff costs of internal administration in 2026: €28.5m[1]
Four demands follow from this. First a freeze on posts: no new posts outside childcare and the fire service until the budget consolidation plan is adopted. Second an AI target in euros, that is a binding, quantified savings target through AI and automation in the 2027 budget, with an annual report to the council. Third a target figure for posts per inhabitant: back to the 2019 level, 11.9 per 1,000, by 2030. Fourth transparency: annual publication of posts, staff costs and AI projects by department.
METHOD
Method
The budget figures come from the annual accounts for 2014 to 2024 and the 2026 budget plan. Staff and pension expenditure for 2016 to 2026 follows the time series in the 2026 preliminary report (figure 20), and for 2014 and 2015 the income statement of the annual accounts.
The index series in the second chart are calculated from the values in the table: each value divided by the 2014 value, times 100, rounded to whole numbers.
The percentages in the text are our own calculations from the same values.
The axes of all the charts begin at zero (docs/04-designsystem.md). A truncated axis makes small differences look large.
Posts are established posts according to the establishment plan, not full-time posts filled. PD gives around 2,040 posts filled.
CHECK
What was checked before publication
- All the budget figures come from the publicly available annual accounts and the 2026 budget plan of the city of Paderborn. Values up to 2024 are audited actuals, 2025 and 2026 are planned figures.
- The editorial team relies on the analysis of these documents that it holds. A recalculation of every individual figure against the city’s original files is still outstanding; anyone finding a discrepancy is asked to report it via “Report an error”.
- Posts are established posts according to the establishment plan. The full-time posts actually filled are fewer; PD gives around 2,040. That is to be kept in mind with every figure for posts.
- The population figures for 2025 and 2026 are a projection by IT.NRW, not counted values.
- The statements on AI come from publications by McKinsey, the Bundestag’s research service and an analysis by the IW. They are assessments of the public service in general, not a measurement for Paderborn.
- No statement from the city of Paderborn was available at the time of publication. What the city puts forward to explain the increase appears in the section “What speaks for the city”.
SOURCES
Sources
Every number in the text leads to its source. The origin is given at each entry: official, media report, trade association, institute or data portal. Titles stay in the original language, so that each document can still be found.
[1] Stadt Paderborn
Haushaltsplan 2026, Band 1: Vorbericht und Anlagen, unter anderem Stellenentwicklung 2006 bis 2026 (Seite 170) sowie Abbildungen 20, 32 und 34Official source↑ back to the text
[2] Stadt Paderborn
Jahresabschlüsse 2014 bis 2024, ErgebnisrechnungenOfficial source↑ back to the text
[3] PD – Berater der öffentlichen Hand, 01.10.2026
Konsolidierungskonzept für die Stadt PaderbornInstitute or public body↑ back to the text
[4] Stadt Paderborn, Oktober 2026
Pressemitteilung „Beratungsunternehmen stellt dem Rat Sparvorschläge vor“Official source↑ back to the text
[5] Statistisches Bundesamt
Verbraucherpreisindex, Jahresdurchschnitte (2020 = 100)Official source↑ back to the text
[6] McKinsey & Company, 15.07.2024
Generative KI könnte Fachkräftelücke im öffentlichen Dienst um ein Drittel verkleinernInstitute or public body↑ back to the text
[7] McKinsey & Company, 15.05.2025
KI-Agenten im Einsatz: So wird die öffentliche Verwaltung zukunftssicherInstitute or public body↑ back to the text
[8] Wissenschaftliche Dienste des Deutschen Bundestages
Künstliche Intelligenz: Einsatz in der öffentlichen Verwaltung (WD 7-004-25)Official source↑ back to the text
[9] Berliner Morgenpost, 15.07.2026
Auswertung des Instituts der deutschen Wirtschaft zu KI-Stellen in BehördenMedia report↑ back to the text
CORRECTIONS
Corrections
No corrections since publication on 18/10/2026. Every substantive change appears here with its date, reason and previous wording.