BACKGROUNDDATA CHECKGROWTH AND INDUSTRIAL PRODUCTION
Seven years, two per cent
In Lucerne Hans-Werner Sinn named two findings: Germany is right at the back on growth, and its industry is shrinking while its neighbours’ is growing. We have recalculated both from the databases of the IMF and Eurostat.
Basis: our own analysis of the databases of the IMF and Eurostat, prompted by the lecture given by Hans-Werner Sinn on 21 October 2026 at the IWP in Lucerne
5 minutes read5 sources0 corrections
Share
Contents
0.3%
real growth per year in Germany, 2018 to 2025
Last place among 20 economies and groups of countries compared.[1]
+2.0%
growth over seven years in total
World economy over the same period: +22.8 per cent.[1]
−15.2%
industrial production against 2018
Manufacturing, first half of 2026.[2]
+26.0%
Switzerland’s industrial production over the same period
Austria +5.7 per cent, EU-27 +1.7 per cent.[2]
On 21 October 2026 the economist Hans-Werner Sinn gave a lecture on the state of the German economy at the Institute for Swiss Economic Policy in Lucerne.[5] Two of his findings were passed on afterwards: that since 2018 Germany has been, together with Japan, bottom of the OECD on growth, and that real production in manufacturing has fallen by 16 per cent since 2018, in the car industry by 25, in machinery by 23 and in chemicals by 22 per cent.[4]
We recalculated both, rather than copying them. The figures below come from the databases of the International Monetary Fund[1] and of Eurostat[2], accessed on 26 October 2026. The result for Germany matches Sinn’s figures almost exactly. For some other countries it does not – more on that below.
Two per cent in seven years
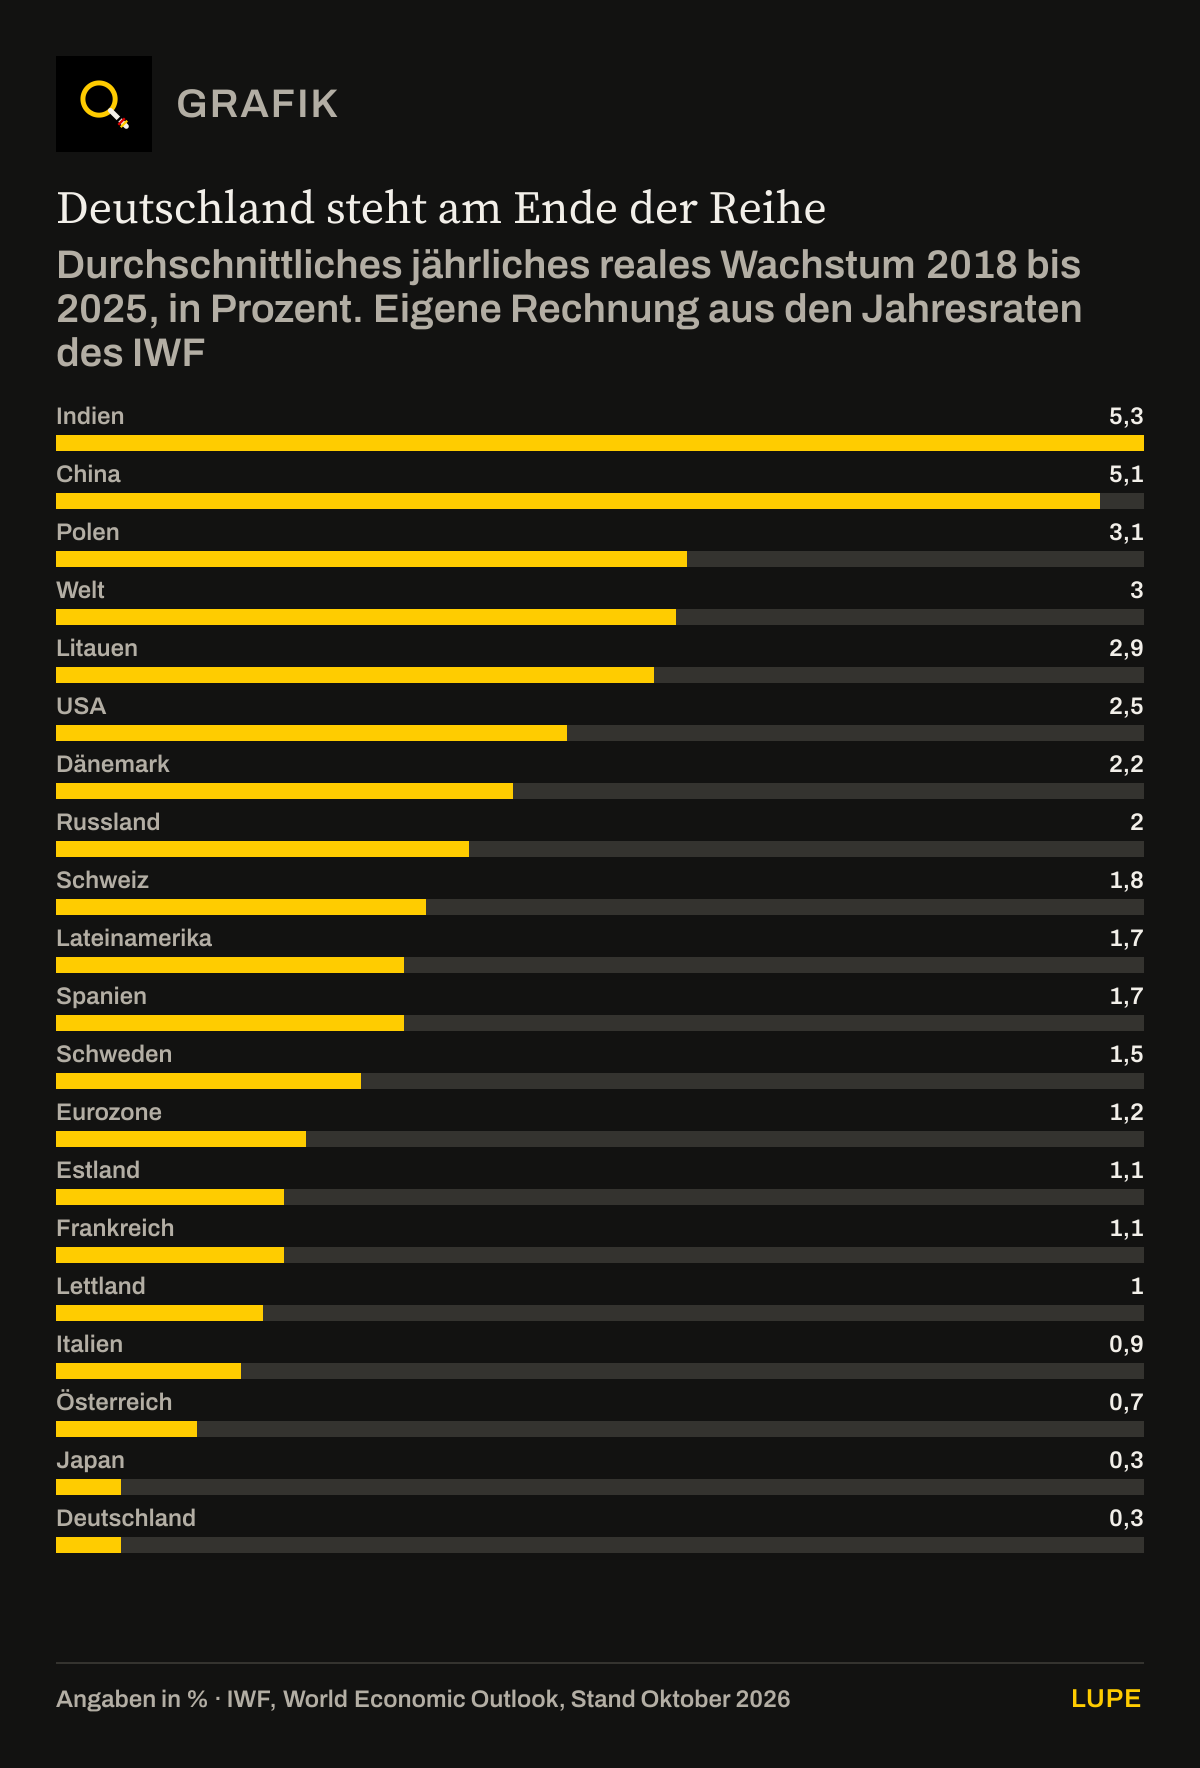
German economic output grew by 2.0 per cent in real terms from 2018 to 2025. Not per year, but in total. Converted, that is 0.3 per cent a year. Over the same period the world economy grew by 22.8 per cent, the euro area by 8.5 per cent, the United States by 18.5 per cent.[1] For the last year of the series the IMF and the Federal Statistical Office agree: in 2025 the German economy grew by 0.2 per cent.[3]
Germany stands at the end of the line
Average annual real growth 2018 to 2025, in per cent. Our own calculation from the IMF’s annual rates
IMF, World Economic Outlook, as at October 2026[1]. Chart redrawn from the figures in the text.
Limits of the data: “World”, “euro area” and “Latin America” are IMF country groups and stand beside the individual countries, not above them. Japan and Germany lie at the same place after the decimal point: Japan reaches 0.32 per cent, Germany 0.29. The gap between the two is smaller than the usual data revision.
Download the chart as an image (PNG)
Show data table20 rows
| Growth per year (%) | |
|---|---|
| India | 5.3 |
| China | 5.1 |
| Poland | 3.1 |
| World | 3 |
| Lithuania | 2.9 |
| USA | 2.5 |
| Denmark | 2.2 |
| Russia | 2 |
| Switzerland | 1.8 |
| Latin America | 1.7 |
| Spain | 1.7 |
| Sweden | 1.5 |
| Euro area | 1.2 |
| Estonia | 1.1 |
| France | 1.1 |
| Latvia | 1 |
| Italy | 0.9 |
| Austria | 0.7 |
| Japan | 0.3 |
| Germany | 0.3 |
The series follows the chart from the lecture in its selection of countries, not in its values. Germany stands in last place, Japan immediately before it – that corresponds to Sinn’s own formulation that Germany is bottom together with Japan.[4] The chart itself, by contrast, shows Japan at 1.2 per cent, that is clearly above Germany. The IMF’s data do not support that value.
Why one mean is not the same as another here: in 2020 Germany had a fall of 4.0 per cent and in 2021 a rise of 4.0 per cent. Added together that gives zero; calculated properly a loss remains, because the rise works on the smaller base. We therefore use the geometric mean: the annual growth that leads from 2018 to 2025 to the level actually reached. The simple average of the seven annual rates would give Germany 0.31 rather than 0.29 per cent.
What the gap means is shown by a simple counter-calculation. Had the German economy grown since 2018 at the pace of the euro area – not at the pace of the world, the United States or Poland, but at the average of its own currency area – economic output in 2025 would be a good 6 per cent higher than it is. That is a model calculation and not a forecast; the arithmetic is set out under “How we calculated”.
Industry: Germany falls, the neighbours do not
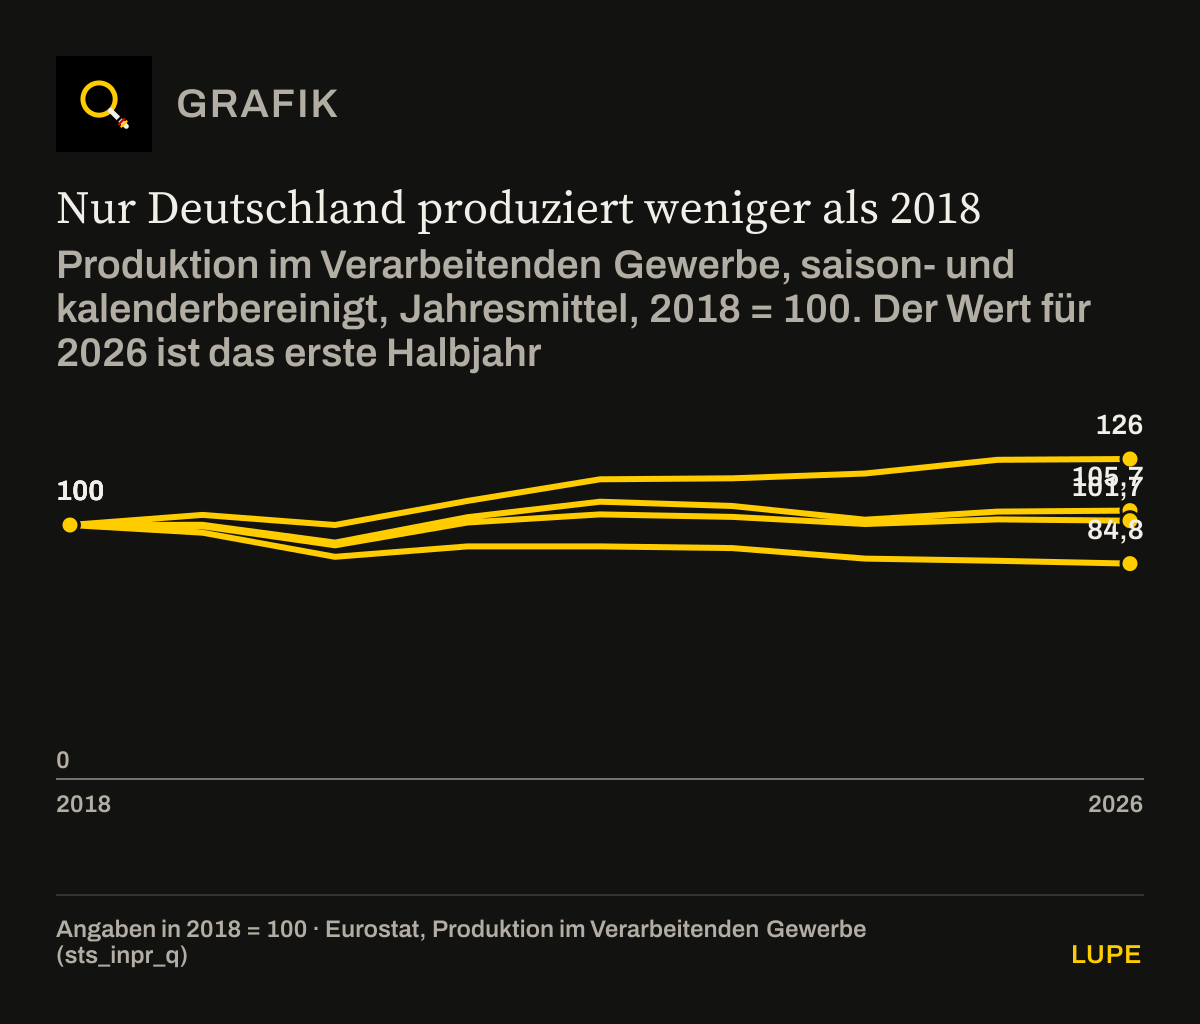
The second finding concerns manufacturing. Here the position is clearer than for overall growth, and here it can best be tested whether Germany shares a European problem or has one of its own. Eurostat keeps the same series by the same rules for Germany, Austria, Switzerland and the EU.[2]
Only Germany produces less than in 2018
Production in manufacturing, seasonally and calendar adjusted, annual means, 2018 = 100. The value for 2026 is the first half-year
- Germany
- Switzerland
- Austria
- EU-27
Eurostat, production in manufacturing (sts_inpr_q)[2]. Chart redrawn from the figures in the text.
Limits of the data: Since 2018 Switzerland has gained 26.0 per cent, Austria 5.7 per cent, the EU-27 1.7 per cent. Germany has lost 15.2 per cent. For Germany 2018 was at the same time the highest annual mean since the series began in 2000; every later year lies below it. The Swiss values fluctuate strongly, because pharmaceutical production carries a large weight.
Download the chart as an image (PNG)
Show data table9 rows
| Germany (2018 = 100) | Switzerland (2018 = 100) | Austria (2018 = 100) | EU-27 (2018 = 100) | |
|---|---|---|---|---|
| 2018 | 100 | 100 | 100 | 100 |
| 2019 | 97 | 104 | 100.1 | 99.5 |
| 2020 | 87.5 | 100 | 93.1 | 92 |
| 2021 | 91.6 | 109.5 | 103.1 | 101 |
| 2022 | 91.6 | 118 | 109.2 | 104.2 |
| 2023 | 90.9 | 118.4 | 107.5 | 103.2 |
| 2024 | 86.8 | 120.3 | 102.1 | 100.4 |
| 2025 | 85.9 | 125.7 | 105.3 | 102.2 |
| 2026 | 84.8 | 126 | 105.7 | 101.7 |
The path separates two things that often run together in the debate. The slump in the coronavirus year 2020 hit all four, Switzerland least. After that Germany is the only one not to climb back: Austria, Switzerland and the EU have been above the 2018 level in every year since 2021. Germany has fallen further in every year since 2022 and in the first half of 2026 lies even below the coronavirus year 2020.
| Branch | Change since 2018 | Figure given in the lecture |
|---|---|---|
| Manufacturing as a whole | −15.2% | −16% |
| Motor vehicles and parts | −23.2% | −25% |
| Machinery | −21.3% | −23% |
| Chemical products | −21.1% | −22% |
The right-hand column is the figure from the lecture.[4] The deviations of one to two percentage points are plausibly explained by a different reference period – anyone calculating up to the end of 2025 arrives at different values from someone including the first half of 2026. The finding itself stands in all four rows.
This chart does not prove what the cause is. But it rules out one explanation that is often heard: that this is a general European development to which Germany is merely particularly exposed. The EU as a whole produces more today than in 2018, Austria as an immediate neighbour with a similar industrial structure does too, and Switzerland considerably more. Whatever the causes, they work differently in Germany from next door.
What these figures do not say
They do not say what the cause is. Demography, energy prices, regulation, export markets, tariffs and the structure of German industry are not separated out in this calculation; anyone naming a cause needs evidence of their own for it. Nor do they say anything about the future: the IMF expects growth for Germany of 1.3 per cent in 2026 and 1.1 per cent in 2027.[1] Third, they are no verdict on living standards or prosperity – gross domestic product measures production, not quality of life, and industrial production measures quantity, not value added per employee. And fourth, they are open to revision: both the IMF series and the Eurostat index are continually revised, the value for the first half of 2026 particularly so.
What remains is a checked finding in two sentences. The German economy has grown by 2.0 per cent in seven years and thereby stands at the end of a comparison of 20 economies. Its industry produces 15 per cent less than in 2018, while its neighbours’ produces more.
METHOD
Method
Average annual growth: geometric mean of the seven annual rates from 2019 to 2025 from the IMF series NGDP_RPCH. For Germany (1.1; −4.0; 4.0; 1.9; −1.0; 0.0; 0.2 per cent) the product of the growth factors is 1.0198, that is 2.0 per cent over seven years; the seventh root of that is 1.0029, that is 0.29 per cent a year. For comparison, the simple average of the same seven rates: 0.31 per cent.
Counter-calculation for the euro area: over the same period the euro area grows cumulatively by 8.5 per cent, Germany by 2.0 per cent. 1.085 divided by 1.020 gives 1.064, that is a good 6 per cent. The calculation applies an average rate to a single economy and says nothing about whether that growth would have been achievable.
Industrial production: Eurostat sts_inpr_q, manufacturing (NACE C), seasonally and calendar adjusted, original index 2021 = 100. Annual means from the four quarters, for 2026 from the two available. Rebased to 2018 = 100 by division by the annual mean for 2018 (Germany 108.375; Austria 96.525; Switzerland 91.275; EU-27 99.0). Change to the first half of 2026: Germany 91.85 against 108.375 gives −15.2 per cent; Austria 102.0 against 96.525 gives +5.7; Switzerland 115.05 against 91.275 gives +26.0; EU-27 100.7 against 99.0 gives +1.7 per cent.
Branches of the same series for Germany: chemical products (C20) 77.85 against 98.675 gives −21.1 per cent, machinery (C28) 86.75 against 110.275 gives −21.3 per cent, motor vehicles and parts (C29) 102.85 against 133.9 gives −23.2 per cent.
CHECK
What was checked before publication
- The occasion is two charts from the lecture “Deutschlands grosse Krise” given by Hans-Werner Sinn on 21 October 2026 at the Institute for Swiss Economic Policy in Lucerne (sources 4 and 5). The figures do not come from those charts. On 26 October 2026 we calculated both charts ourselves from the databases: the IMF World Economic Outlook, as at October 2026 (source 1), and Eurostat, quarterly data on production in manufacturing (source 2).
- The recalculation was necessary and it found something. For Germany the findings match almost exactly: we calculate 0.3 per cent growth a year against 0.2 in the chart, and 15.2 per cent less industrial production against 16 per cent in Sinn’s figures. For several other countries the values differ markedly, most of all for India (5.3 instead of 7.6), Japan (0.3 instead of 1.2) and Spain (1.7 instead of 2.8). Where the values in the charts come from is not known to us; no slide set of the lecture has been published. This report therefore shows exclusively the series we calculated ourselves.
- The growth figure is the geometric mean of the seven annual rates from 2019 to 2025, that is the annual growth of an economy starting in 2018. Not the average of the seven percentages: that comes out higher, because a slump and an equally large recovery do not add up to zero.
- Industrial production is the index of manufacturing (NACE C), seasonally and calendar adjusted, rebased by us to 2018 = 100. The last point is the first half of 2026; a complete year 2026 is not available. The Swiss series begins at Eurostat only in 2010 and fluctuates strongly, because pharmaceutical production carries a large weight: the second quarter of 2026 alone is around 10 per cent above the first.
- Not checked and therefore not included: the lecture’s further statements on demography, net investment, energy and climate policy. Sinn was not asked for comment. The lecture’s economic policy conclusions are his position and are not the subject of this report.
SOURCES
Sources
Every number in the text leads to its source. The origin is given at each entry: official, media report, trade association, institute or data portal. Titles stay in the original language, so that each document can still be found.
[1] Internationaler Währungsfonds (IWF), abgerufen 26.10.2026
World Economic Outlook Database, Stand Oktober 2026: Reales Bruttoinlandsprodukt, Veränderung gegenüber dem Vorjahr (Reihe NGDP_RPCH), Jahreswerte 2019 bis 2025 sowie Prognosen 2026 und 2027Data portal↑ back to the text
[2] Eurostat, abgerufen 26.10.2026
Produktion im Verarbeitenden Gewerbe, Quartalsdaten (sts_inpr_q), saison- und kalenderbereinigt, Index 2021 = 100, Wirtschaftszweige C, C20, C28 und C29, Deutschland, Österreich, Schweiz und EU-27, 1. Quartal 2000 bis 2. Quartal 2026Data portal↑ back to the text
[3] Statistisches Bundesamt (Destatis), 15.01.2026
Bruttoinlandsprodukt im Jahr 2025 um 0,2 % gewachsen (Pressemitteilung Nr. 017), amtlicher Wert für das letzte Jahr der ReiheOfficial source↑ back to the text
[4] IWP Institut für Schweizer Wirtschaftspolitik, Universität Luzern, Stand 26.10.2026
„«15 Jahre Merkel rückabwickeln», sagt Hans-Werner Sinn“ – Bericht über den Vortrag vom 21. Oktober 2026, mit den Angaben zu Wachstum und IndustrieproduktionInstitute or public body↑ back to the text
[5] Hans-Werner Sinn, 21.10.2026
Vortrag „Deutschlands grosse Krise: Analyse und Politikoptionen“, IWP Luzern, 21. Oktober 2026, VideoaufzeichnungInstitute or public body↑ back to the text
CORRECTIONS
Corrections
No corrections since publication on 26/10/2026. Every substantive change appears here with its date, reason and previous wording.