OPINIONCOMMENTARYENERGY PRICES
Once again Germany knows better than the whole world. Or does it?
Energy costs are destroying German prosperity and German industry.
By Andreas W. Herb, CEO MBG Group, Paderborn
8 minutes read44 sources0 correctionsDisclosure
Share
Contents
On 15 April 2023 Isar 2, Emsland and Neckarwestheim 2 went off the grid, Germany’s last three nuclear power stations.[1] There may be no new ones. The atomic energy act says so expressly: “For the construction and operation of installations for the fission of nuclear fuels for the commercial generation of electricity … no licences shall be granted.”[2]
By the end of 2038 at the latest the last coal-fired power station is to go off the grid too; that is what the coal phase-out act says.[3] So Germany is leaving two sources of energy at the same time. The question is whether that is wiser than the path the others are taking. The answer begins on the electricity bill.
Electricity prices compared
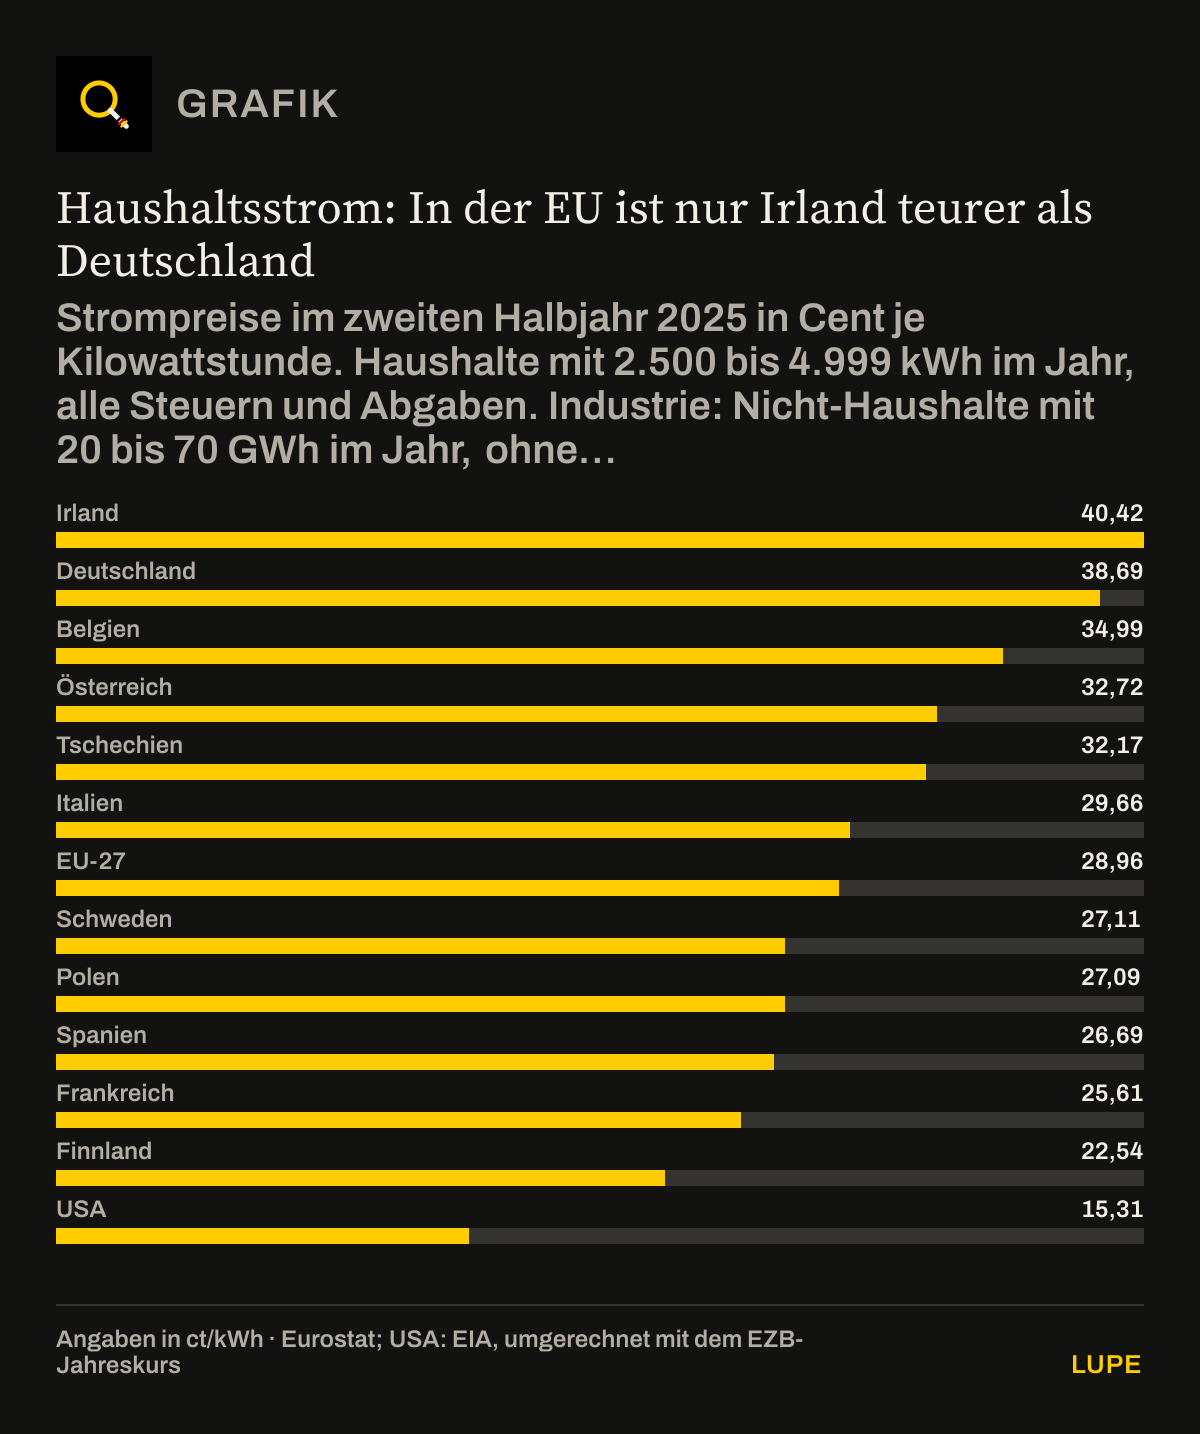
In the second half of 2025 households in Germany paid on average 38.7 cents per kilowatt hour, with all taxes and levies included. In the EU electricity was more expensive only in Ireland. German households paid a good third more than the EU average of 29.0 cents.[4]
Businesses consuming 20,000 to 70,000 megawatt hours a year, that is medium-sized industry, paid 16.0 cents excluding VAT: 19 per cent more than the EU average and almost twice as much as in France.[5] Industry in the United States paid the equivalent of 7.6 cents in 2025, less than half the German price.[6][7]
Household electricity: in the EU only Ireland is more expensive than Germany
Electricity prices in the second half of 2025 in cents per kilowatt hour. Households using 2,500 to 4,999 kWh a year, all taxes and levies. Industry: non-household customers using 20 to 70 GWh a year, excluding VAT and refundable levies. A selection of eleven EU countries, the EU average and the United States
- Households
- Industry
Eurostat[4][5]; USA: EIA[6], converted at the ECB’s annual rate[7]. Chart redrawn from the figures in the text.
Limits of the data: USA: annual mean for 2025, provisional, across all customers in a sector; a different method, comparable only as an order of magnitude. Austria: Eurostat estimate. For industry Germany ranks 10th of 27 in the EU. Accessed on 9 October 2026.
Download the chart as an image (PNG)
Show data table13 rows
| Households (ct/kWh) | Industry (ct/kWh) | |
|---|---|---|
| Ireland | 40.42 | 19.7 |
| Germany | 38.69 | 15.95 |
| Belgium | 34.99 | 13.11 |
| Austria | 32.72 | 16.32 |
| Czech Republic | 32.17 | 16.4 |
| Italy | 29.66 | 16.43 |
| EU-27 | 28.96 | 13.42 |
| Sweden | 27.11 | 7.22 |
| Poland | 27.09 | 16.4 |
| Spain | 26.69 | 10.85 |
| France | 25.61 | 8.53 |
| Finland | 22.54 | 5 |
| USA | 15.31 | 7.63 |
On industrial prices Germany is not top in the EU: Italy, Poland, the Czech Republic and Austria were higher in the same half-year.[5] But the big competitors on the world market pay less, the United States above all.[6]
In 2026 household electricity has become somewhat cheaper, above all because network charges have fallen by 1.7 cents. For this year the BDEW so far gives an average of 37.0 cents. Taxes, levies and surcharges still make up 12.6 cents of that, a good third of the price.[8]
The world is building nuclear power stations
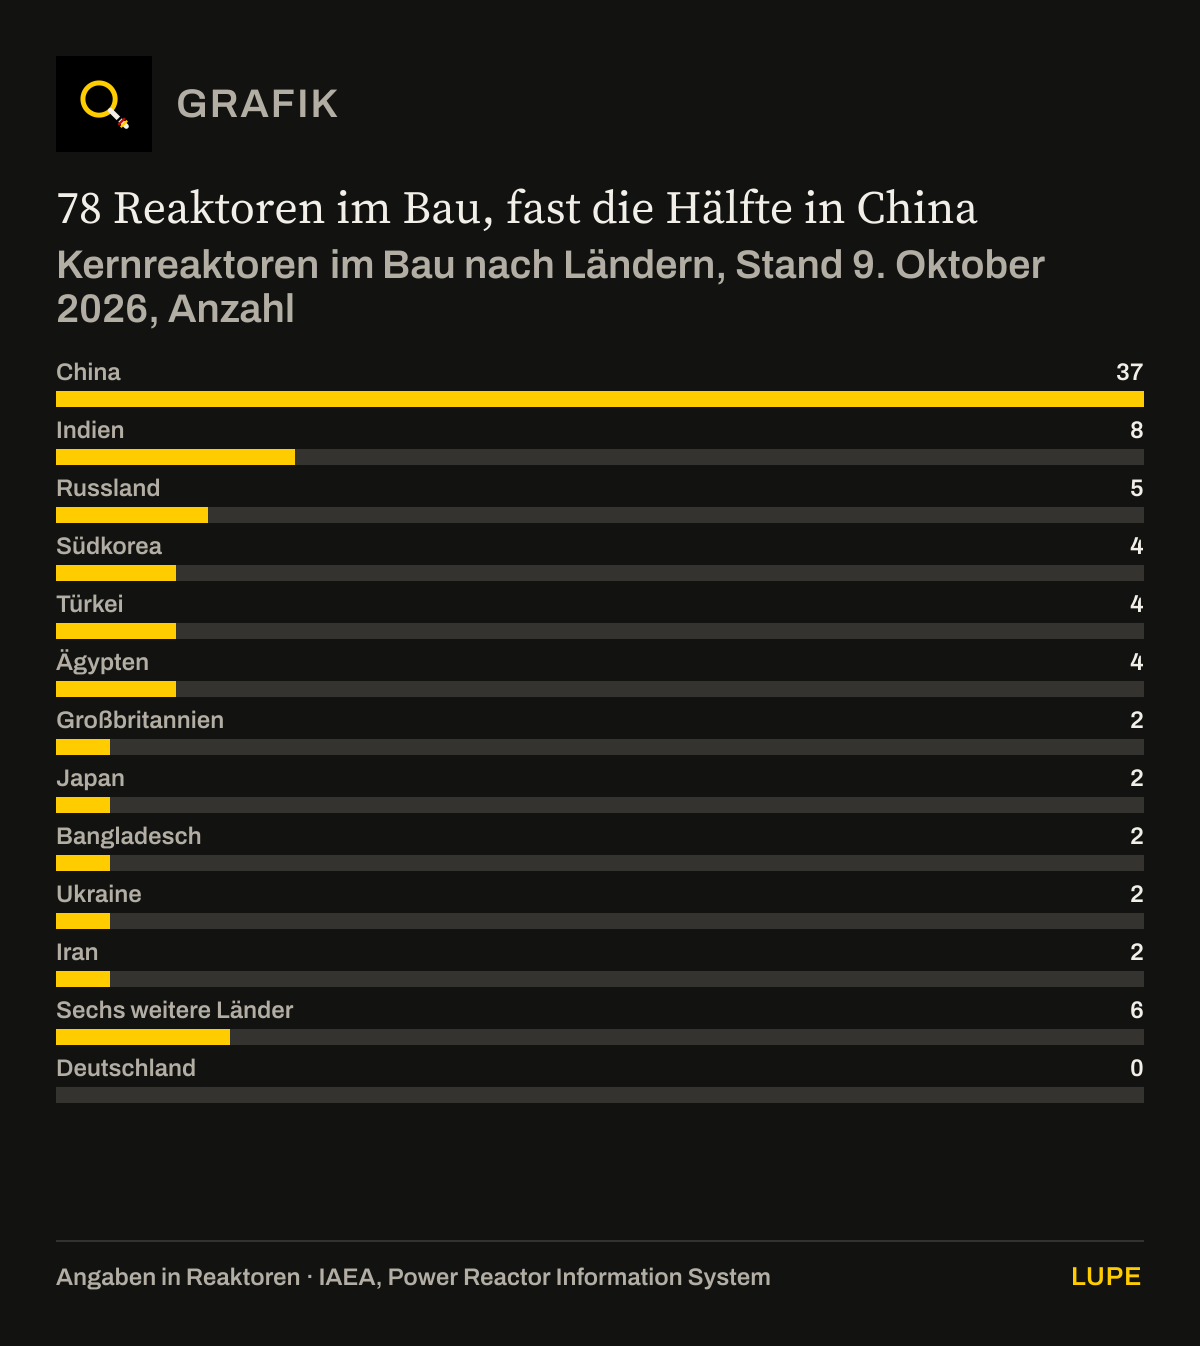
Worldwide 78 nuclear reactors are under construction, spread over 17 countries. In operation are 417 reactors in 31 countries. Almost half of the new builds are in China: 37 reactors.[9]
78 reactors under construction, almost half of them in China
Nuclear reactors under construction by country, as at 9 October 2026, number
IAEA, Power Reactor Information System[9]. Chart redrawn from the figures in the text.
Limits of the data: One reactor each in Brazil, Hungary, Pakistan, Slovakia, Canada and Argentina. Counted from the start of construction; projects that have been decided, such as in Poland, the Czech Republic or Sizewell C in the United Kingdom, are still missing. Some reactors have been listed as “under construction” for decades, for instance two in Ukraine since 1986 and 1987.
Download the chart as an image (PNG)
Show data table13 rows
| Reactors under construction (Reactors) | |
|---|---|
| China | 37 |
| India | 8 |
| Russia | 5 |
| South Korea | 4 |
| Turkey | 4 |
| Egypt | 4 |
| United Kingdom | 2 |
| Japan | 2 |
| Bangladesh | 2 |
| Ukraine | 2 |
| Iran | 2 |
| Six further countries | 6 |
| Germany | 0 |
Europe is turning too. In July 2025 the United Kingdom took the final investment decision for Sizewell C, a power station of 3.2 gigawatts.[10] In December 2025 Poland obtained the EU Commission’s approval for state support for its first nuclear power station.[11] In June 2025 the Czech Republic signed the contract for two new units at Dukovany.[12] Sweden has supported new reactors by law since August 2025.[13]
Even countries with a phase-out decision are turning back. In May 2025 Belgium amended its act: since June 2025 it is no longer called the act on the “gradual phase-out” of nuclear energy but the act on nuclear energy for electricity generation.[14] In September 2026 Italy passed an act under which the government is to regulate a return.[15] The Swiss parliament wants to lift the ban on new builds; Switzerland is expected to vote on this in 2027.[16]
The United States wants to quadruple its nuclear capacity from around 100 gigawatts in 2024 to 400 gigawatts by 2050; at present, however, no reactor is being built there.[9][17] Japan wants to raise nuclear power’s share of electricity to around 20 per cent by 2040; in 2023 it was 8.5 per cent.[18]
At the 2023 climate conference 25 states declared that nuclear power would be tripled worldwide by 2050, among them the United States, France, the United Kingdom, Japan, Sweden and Poland.[19] By now there are 38, including China, Belgium and Italy since 2026.[20] Germany is not among them.[19][21]
Coal is being built above all in Asia
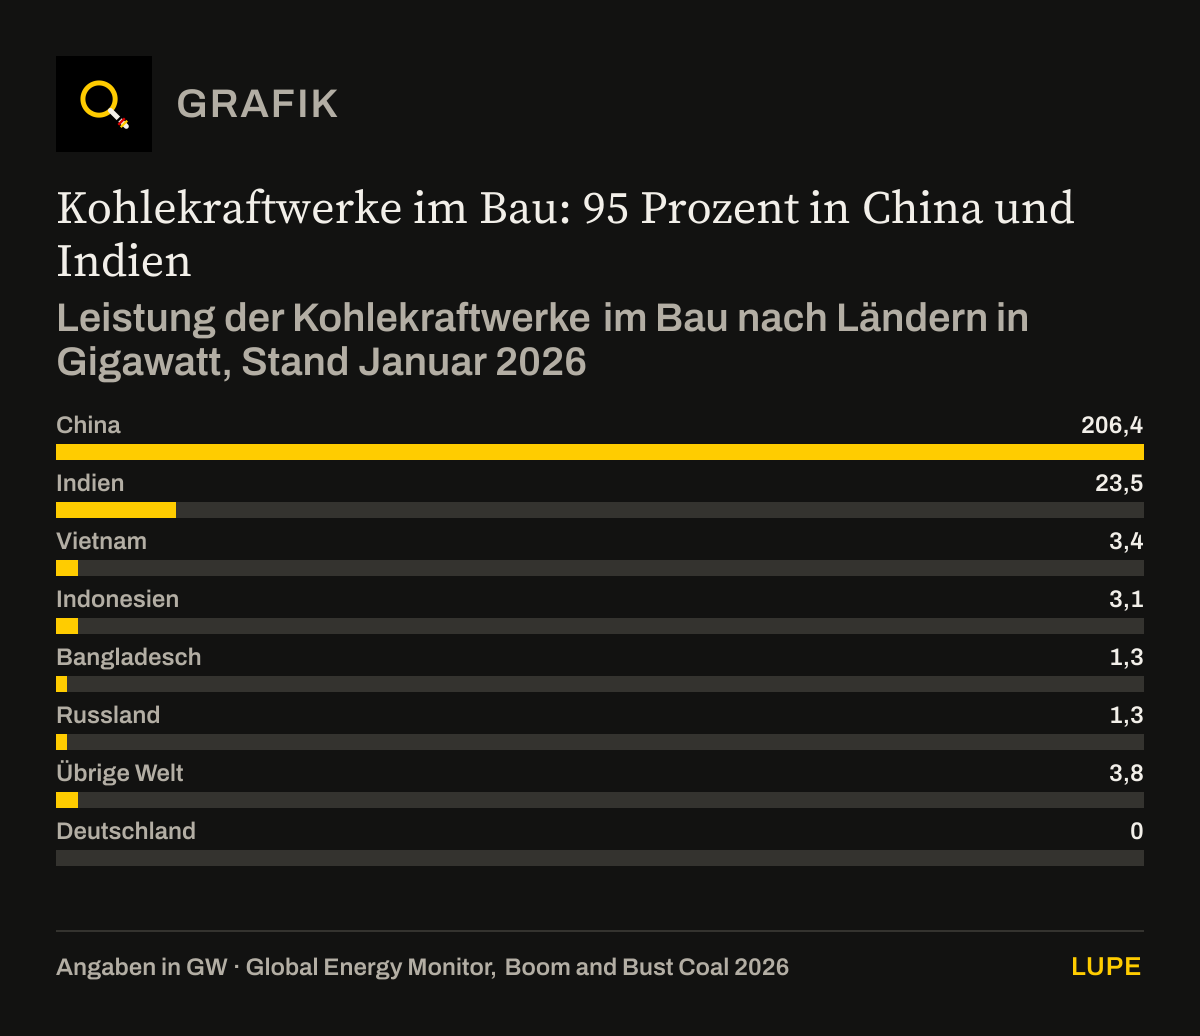
On coal the picture is different. At the beginning of 2026 coal-fired power stations with 243 gigawatts were under construction worldwide, 95 per cent of them in China and India. China alone is building 206 gigawatts, more than seven times all the German coal-fired power stations still in operation. In 2025 coal-fired power stations with around 97 gigawatts came onto the grid worldwide, 78 of them in China.[22]
Coal-fired power stations under construction: 95 per cent in China and India
Capacity of coal-fired power stations under construction by country in gigawatts, as at January 2026
Global Energy Monitor, Boom and Bust Coal 2026[22]. Chart redrawn from the figures in the text.
Limits of the data: 242.8 GW worldwide. “Rest of the world”: eleven countries, among them the Philippines, Iran and Zimbabwe. Units from 30 MW are covered. On the data as at July 2026 around 260 GW are under construction worldwide, without a breakdown by country.
Download the chart as an image (PNG)
Show data table8 rows
| Under construction (GW) | |
|---|---|
| China | 206.4 |
| India | 23.5 |
| Vietnam | 3.4 |
| Indonesia | 3.1 |
| Bangladesh | 1.3 |
| Russia | 1.3 |
| Rest of the world | 3.8 |
| Germany | 0 |
Anyone reading from this that China is relying on coal alone is reading only half the statistics. In 2025 China brought more than 430 gigawatts of wind and solar capacity onto the grid.[23] Coal’s share of Chinese electricity has fallen from 70 per cent in 2015 to 54 per cent in 2025.[24] In 2025 more electricity came from renewable sources than from coal worldwide for the first time.[25]
So China is building everything that delivers electricity: coal, nuclear, wind and sun. Germany is relying on wind and sun and has ruled out nuclear power by law.
What that costs industry
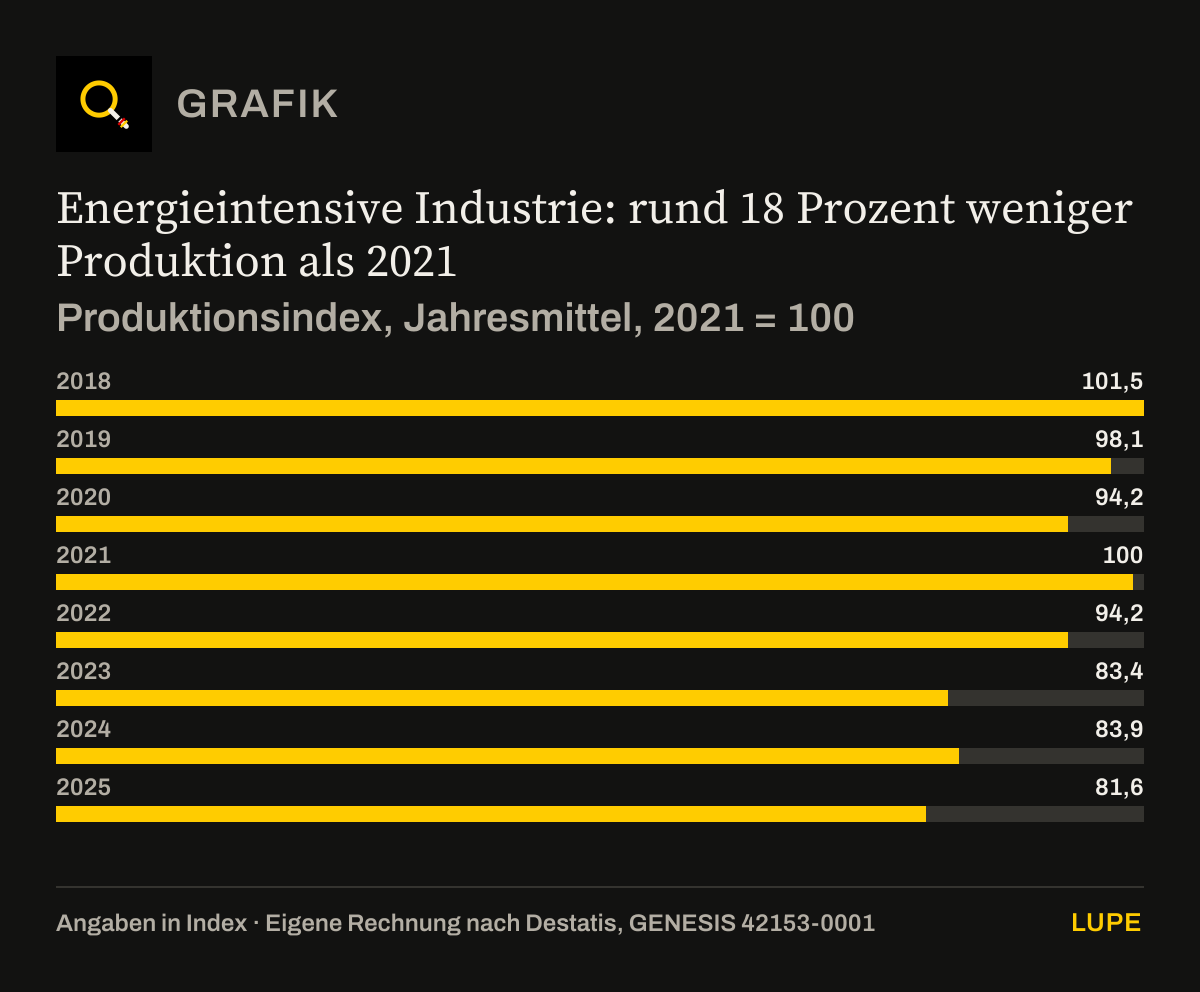
The consequences show first where energy is the largest cost block. The Federal Statistical Office counts among the energy-intensive branches chemicals, metal production, paper, glass and ceramics as well as coking plants and mineral oil processing.[26] In 2025 they produced around 18 per cent less than in 2021. The rest of industry lost 5 per cent over the same period.[27]
Energy-intensive industry: around 18 per cent less production than in 2021
Production index, annual means, 2021 = 100
- Energy-intensive branches
- Rest of industry
Own calculation based on Destatis, GENESIS 42153-0001[27]. Chart redrawn from the figures in the text.
Limits of the data: Annual mean of the twelve monthly values, as at 9 October 2026, values provisional. Rest of industry: industry excluding energy, construction and the energy-intensive branches.
Download the chart as an image (PNG)
Show data table8 rows
| Energy-intensive branches (Index) | Rest of industry (Index) | |
|---|---|---|
| 2018 | 101.5 | 109.3 |
| 2019 | 98.1 | 105.9 |
| 2020 | 94.2 | 95.6 |
| 2021 | 100 | 100 |
| 2022 | 94.2 | 100.9 |
| 2023 | 83.4 | 101.6 |
| 2024 | 83.9 | 95.8 |
| 2025 | 81.6 | 95 |
From February 2022 to March 2026 production in chemicals fell by 18 per cent, and in glass, ceramics and cement by 25 per cent. In March 2026 around 53,300 fewer people were working in the energy-intensive branches than in February 2022.[26] Across the whole of manufacturing, around 228,000 fewer people were in employment in 2025 than in 2023.[28]
And businesses are planning further. In the DIHK’s energy transition barometer of July 2026, around 40 per cent of industrial businesses are considering moving production or investment abroad or are already doing so, and among large industrial companies 60 per cent. The question asked was about energy and climate policy conditions as a whole.[29]
In 2025 ArcelorMittal abandoned its plans for climate-friendly steel in Bremen and Eisenhüttenstadt, despite promised support of 1.3 billion euros. Electricity prices in Germany are high, in international comparison as well as against neighbouring countries, the group writes. It intends to build its next electric furnace in Dunkirk in France.[30] Since 2023 BASF has been closing several plants in Ludwigshafen, among them one of two ammonia plants, and named high energy prices as a burden.[31]
That hits prosperity. In 2025 real gross domestic product per inhabitant was 0.8 per cent below the 2019 level.[32] The economy shrank by 1.0 per cent in 2023, stood still in 2024 and grew by 0.2 per cent in 2025.[33]
Or does it?
An honest commentary also shows the other side. Germany is not alone: Spain wants to switch off all its nuclear power stations by 2035, but has just extended the life of Almaraz to 2030.[34] Taiwan switched off its last reactor in May 2025; in March 2026 the operator submitted a plan to restart it.[9][35]
New nuclear power stations are no quick solution. Poland wants to pour the first nuclear concrete at the end of 2028, with electricity flowing from 2036.[36] France’s six new reactors are to run from 2038 and, according to plan, to cost 72.8 billion euros at 2020 prices; the final investment decision is still outstanding.[37] Some projects have been listed as “under construction” for decades.[9]
Not every decline in industry has to do with energy. For the export economy the Federal Statistical Office names for 2025 higher US tariffs, the appreciation of the euro and stronger competition from China.[38]
And the federal government has taken counter-measures. Since January 2026 manufacturing industry has paid only the EU minimum rate of electricity tax.[39] In 2026 the federal government subsidised transmission network charges with 6.5 billion euros.[40] The gas storage levy has been abolished.[41] An industrial electricity price for the years 2026 to 2028 with a target price of 5 cents per kilowatt hour was approved by the EU Commission in April 2026; applications and payments start in 2027, retroactively for 2026.[42]
On top of that comes a new price push from outside in 2026. In producer prices, energy was 8.3 per cent more expensive in August 2026 than a year earlier; mineral oil products cost 40.5 per cent more because of the fighting in Iran and the Middle East.[43]
My conclusion: the world is not more stupid than Germany
The counter-arguments are correct. They do not change the result. German households pay the second-highest electricity prices in the EU, industry pays around twice as much as in the United States, and the energy-intensive businesses are shrinking faster than the rest of the economy. At the same time Germany is holding on to a statutory ban on building new nuclear power stations, while Belgium strikes its phase-out out of the law, Italy prepares a return and the Swiss parliament wants to lift its ban.
I am not demanding that Germany build reactors tomorrow. I am demanding that it stop feeling cleverer than the rest of the world. Three things would be a start.
First: electricity prices are a question of location. The subsidy for network charges and the industrial electricity price are time-limited. Anyone deciding today about a factory for twenty years needs prices they can count on.
Second: the ban on new builds in the atomic energy act belongs struck out. Whether a power station pays should be decided by investors, not by a sentence in a statute. The ban deters engineers, manufacturers and financiers of new, smaller reactor types before they even start calculating.
Third: the coal phase-out for 2038 is in the law. The act provides for a review in 2026, 2029 and 2032 of whether it is already possible in 2035.[44] It should be brought forward only if affordable and secure replacement capacity is on the grid.
Does Germany know better than the whole world? The figures say: no. The world is building what makes electricity affordable and secure. Germany should belong to it again.
Andreas W. HerbCEO MBG Group, Paderborn
CHECK
What was checked before publication
- All 44 sources were accessed on 9 October 2026. Values from databases (Eurostat, IAEA PRIS, Destatis GENESIS) have been read directly from their interfaces, not copied from charts.
- Electricity prices (sources 4 and 5): second half of 2025, data as at 7 and 8 October 2026. The first half of 2026 is still incomplete at Eurostat and the EU average is missing; it is therefore not used. For Austria Eurostat reports an estimate.
- Germany’s rank for non-household customers depends on the consumption band: 3rd of 27 at 500 to 2,000 MWh a year, 4th at 2,000 to 20,000 MWh, 10th at 20,000 to 70,000 MWh. The chart shows the last band, which the BDEW also uses for medium-sized industry (source 8).
- USA (sources 6 and 7): the EIA’s 2025 annual values are provisional and are based on revenue divided by sales across all customers in a sector, without consumption bands. Conversion uses the ECB’s 2025 annual average of 1.12998 dollars to the euro. The comparison shows an order of magnitude, not a price defined in exactly the same way.
- Reactors (source 9): PRIS counts a reactor from the start of construction. Projects that have been decided but not started, for instance in Poland, the Czech Republic or Sizewell C, are therefore missing from the chart. PRIS lists Taiwan under China; the 37 reactors under construction are on the Chinese mainland.
- Declaration on tripling nuclear power (sources 19 to 21): the French economics ministry names 38 states in March 2026, the industry association World Nuclear Association 39 in September 2026. Germany appears in neither list.
- Coal (source 22): country values from the Global Coal Plant Tracker, as at January 2026, units from 30 MW. On the data as at July 2026 around 260 gigawatts are under construction worldwide; a breakdown by country for that was not available.
- Production (source 27): annual mean of the twelve monthly values, our own calculation. Destatis itself gives minus 17.8 per cent, calendar adjusted, for 2025 against 2021; both give “around 18 per cent”.
- Causes: besides energy prices the sources name further reasons for the weakness of industry, for instance weak demand, imports, US tariffs and the exchange rate (sources 30, 31 and 38). The commentary claims no sole connection; the section “Or does it?” names the counter-arguments.
SOURCES
Sources
Every number in the text leads to its source. The origin is given at each entry: official, media report, trade association, institute or data portal. Titles stay in the original language, so that each document can still be found.
[1] Bundesamt für die Sicherheit der nuklearen Entsorgung (BASE), Stand 17.04.2023
Isar 2, Emsland & Neckarwestheim 2Official source↑ back to the text
[2] Bundesrecht (gesetze-im-internet.de)
Atomgesetz (AtG), § 7 Genehmigung von Anlagen, Absatz 1 Satz 2Official source↑ back to the text
[3] Bundesrecht (gesetze-im-internet.de)
Kohleverstromungsbeendigungsgesetz (KVBG), § 4 Zielniveau und ZieldatumOfficial source↑ back to the text
[4] Eurostat, Datenstand 08.10.2026
Strompreise für Haushalte, Halbjahresdaten (nrg_pc_204), 2.500 bis 4.999 kWh, alle Steuern und AbgabenData portal↑ back to the text
[5] Eurostat, Datenstand 07.10.2026
Strompreise für Nicht-Haushalte, Halbjahresdaten (nrg_pc_205), 20.000 bis 69.999 MWh, ohne Mehrwertsteuer und erstattungsfähige AbgabenData portal↑ back to the text
[6] U.S. Energy Information Administration (EIA), 24.09.2026
Electric Power Monthly, Table 5.3: Average Price of Electricity to Ultimate CustomersOfficial source↑ back to the text
[7] Europäische Zentralbank
Referenzkurs US-Dollar je Euro, JahresdurchschnittOfficial source↑ back to the text
[8] BDEW Bundesverband der Energie- und Wasserwirtschaft, 21.08.2026
BDEW-Strompreisanalyse Herbst 2026: Haushalte und IndustrieTrade association↑ back to the text
[9] Internationale Atomenergie-Organisation (IAEA), abgerufen 09.10.2026
Power Reactor Information System (PRIS): Reaktoren in Betrieb und im Bau nach LändernData portal↑ back to the text
[10] Regierung des Vereinigten Königreichs
Sizewell COfficial source↑ back to the text
[11] Ministerstwo Energii (Polen), 09.12.2025
Sukces polskiego rządu: Komisja Europejska daje zielone światło dla budowy pierwszej polskiej elektrowni jądrowejOfficial source↑ back to the text
[12] Ministerstvo průmyslu a obchodu (Tschechien), 04.06.2025
EPC contract for completion of Dukovany has been signedOfficial source↑ back to the text
[13] Regeringskansliet (Schweden), 23.12.2025
Videberg Kraft AB ansöker om statligt stöd för att bygga kärnkraftOfficial source↑ back to the text
[14] Belgisches Justizministerium, Datenbank Justel, Fassung vom 05.06.2025
Loi du 31 janvier 2003 sur l'énergie nucléaire à des fins de production industrielle d'électricité, geltende Fassung mit Änderung vom 17.05.2025Official source↑ back to the text
[15] Camera dei deputati (Italien), 30.09.2026
Legge 29 settembre 2026, n. 169: Delega al Governo in materia di energia nucleare sostenibileOfficial source↑ back to the text
[16] Eidgenössisches Departement für Umwelt, Verkehr, Energie und Kommunikation (UVEK), 23.06.2026
Sichere StromversorgungOfficial source↑ back to the text
[17] The White House, 23.05.2025
Ordering the Reform of the Nuclear Regulatory CommissionOfficial source↑ back to the text
[18] Ministry of Economy, Trade and Industry (Japan), 18.02.2025
Cabinet Decision on the Seventh Strategic Energy PlanOfficial source↑ back to the text
[19] U.S. Department of Energy, 01.12.2023
At COP28, Countries Launch Declaration to Triple Nuclear Energy Capacity by 2050Official source↑ back to the text
[20] Ministère de l'Économie (Frankreich), 11.03.2026
Sommet pour l'énergie nucléaire : 38 pays en faveur du triplement des capacités d'ici 2050Official source↑ back to the text
[21] World Nuclear Association, 08.09.2026
Togo endorses global Declaration to Triple Nuclear EnergyTrade association↑ back to the text
[22] Global Energy Monitor, Mai 2026
Boom and Bust Coal 2026Institute or public body↑ back to the text
[23] Nationale Energiebehörde der Volksrepublik China (NEA), 12.02.2026
2025年可再生能源并网运行情况 (Netzanschluss erneuerbarer Energien 2025)Official source↑ back to the text
[24] Ember, 21.04.2026
Global Electricity Review 2026: Major Countries and RegionsInstitute or public body↑ back to the text
[25] Ember, 21.04.2026
Global Electricity Review 2026Institute or public body↑ back to the text
[26] Statistisches Bundesamt (Destatis), 15.05.2026
Energieintensive Industriezweige mit Produktionsrückgang um 15,2 % von Februar 2022 bis März 2026Official source↑ back to the text
[27] Statistisches Bundesamt (Destatis), Datenstand 09.10.2026
GENESIS-Tabelle 42153-0001: Produktionsindex für das Verarbeitende GewerbeData portal↑ back to the text
[28] Statistisches Bundesamt (Destatis), Stand 18.08.2026
Erwerbstätige und Arbeitnehmer nach WirtschaftsbereichenOfficial source↑ back to the text
[29] Deutsche Industrie- und Handelskammer (DIHK), 27.07.2026
Energiewende-Barometer 2026Trade association↑ back to the text
[30] ArcelorMittal, 19.06.2025
ArcelorMittal Europe urges faster implementation of Steel and Metals Action PlanInstitute or public body↑ back to the text
[31] BASF, 24.02.2023
BASF zeigt Widerstandskraft in einem schwierigen Marktumfeld und setzt Maßnahmen zur Stärkung der Wettbewerbsfähigkeit umInstitute or public body↑ back to the text
[32] Statistisches Bundesamt (Destatis), Datenstand 09.10.2026
GENESIS-Tabelle 81000-0001: Bruttoinlandsprodukt, preisbereinigt, je Einwohner (Kettenindex)Data portal↑ back to the text
[33] Statistisches Bundesamt (Destatis), Stand 30.09.2026
Wichtige gesamtwirtschaftliche Größen: Bruttoinlandsprodukt, preisbereinigtOfficial source↑ back to the text
[34] Boletín Oficial del Estado (Spanien), 14.08.2026
Orden TED/864/2026, de 12 de agosto, por la que se concede la renovación de la autorización de explotación de la Central Nuclear Almaraz, Unidades I y IIOfficial source↑ back to the text
[35] Wirtschaftsministerium Taiwan (MOEA), 27.03.2026
Taiwan Power Company Plan to resume operation of No. 3 Nuclear Plant delivered to Nuclear Safety Commission for reviewOfficial source↑ back to the text
[36] Pomorski Urząd Wojewódzki (Polen), 31.03.2026
Wniosek o zezwolenie na budowę elektrowni jądrowej złożonyOfficial source↑ back to the text
[37] Élysée (Frankreich), 12.03.2026
Cinquième Conseil de politique nucléaireOfficial source↑ back to the text
[38] Statistisches Bundesamt (Destatis), 15.01.2026
Bruttoinlandsprodukt im Jahr 2025 um 0,2 % gewachsenOfficial source↑ back to the text
[39] Deutscher Bundestag
Stromsteuer soll auf EU-Mindeststeuersatz gesenkt werdenOfficial source↑ back to the text
[40] Deutscher Bundestag, 08.10.2026
Strompreissenkung durch Zuschuss zu den ÜbertragungsnetzkostenOfficial source↑ back to the text
[41] Die Bundesregierung
Abschaffung der GasspeicherumlageOfficial source↑ back to the text
[42] Bundesministerium für Wirtschaft und Energie, 16.04.2026
Industriestrompreis wird eingeführt – Europäische Kommission genehmigt das Entlastungsinstrument für die energieintensive IndustrieOfficial source↑ back to the text
[43] Statistisches Bundesamt (Destatis), 18.09.2026
Erzeugerpreise im August 2026: +4,6 % gegenüber August 2025Official source↑ back to the text
[44] Bundesrecht (gesetze-im-internet.de)
Kohleverstromungsbeendigungsgesetz (KVBG), § 47 Überprüfungen vorzeitiger StilllegungenOfficial source↑ back to the text
CORRECTIONS
Corrections
No corrections since publication on 09/10/2026. Every substantive change appears here with its date, reason and previous wording.
This page is opinion. Our fact checks are not.